TradingView history diagnosis

Historical data for this resolution is unavailable in TradingView

When historical data for a resolution is unavailable in TradingView, first check the exact symbol, interval, requested date and mode. The requested bars may fall outside the accessible history. Try a recent date at the same interval, then the original date at a higher interval. Record which combination works before changing your plan or script. A working daily chart does not establish minute-by-minute coverage.

Analyze the Available Trade Sample

Identify where the message appears

Save the exact message and the action that triggered it. This guide covers unavailable price history. If candles load but a strategy reports no trades, use the separate Strategy Tester No Data guide. Do not begin by changing entry conditions when the underlying chart cannot supply the requested period.

SurfaceHistory boundaryWhat to record
Ordinary chartIntraday history uses plan-based bar limits and available symbol data. Daily-based charts show the available daily history.Earliest loaded candle, interval, exchange-qualified ticker and session.
Bar ReplayReplay depth varies by symbol, interval and plan; it is not the ordinary chart bar allowance.Use Select date, then Select the first available day. Save that boundary for this interval.
Deep BacktestingUses stored history, with a maximum of two million bars per calculation. Longer selections use their most recent two million bars.Requested dates and actual calculation coverage. Partial coverage can still produce a report.

Reproduce the boundary one change at a time

Use a copy of the chart with standard candles. Keep the exchange-qualified symbol, session, adjustments and account unchanged during the first three checks. The table is a diagnostic procedure, not a claim that a particular TradingView feed is currently failing.

  • A useful reproduction note contains the full ticker, timeframe, mode, session, timezone, failing timestamp, working control timestamp and screenshot of the exact message.
  • For an isolated hole within otherwise available history, compare surrounding bars and the exchange session calendar before calling it a data outage. Ask support to confirm the stored coverage for that exact instrument.
StepChange only thisInterpret the observation
1. Establish a recent controlAt the failing interval, select a recent completed session.If recent bars load, an older-date boundary is a better lead than a general loading failure. If they fail too, capture the error before testing older dates.
2. Bracket the missing periodMove the requested date toward the present at the same interval.Record the last failing date and first working date. Do not assume the boundary is a market holiday or a subscription limit without checking.
3. Test a higher intervalReturn to the original date and change 1 minute to 5 minutes or daily.If only the higher interval works, preserve that result as evidence of interval-dependent coverage. It does not recover the missing lower-interval bars.
4. Inspect the instrument identityCheck exchange prefix, contract expiry and whether the symbol ends in 1! or 2!.A dated contract and a continuous series are different datasets. Record a substitution as a new test, including rollover and adjustment settings.
5. Isolate a possible service problemReload the saved chart and test a second symbol at a recent date. Check TradingView service status.Failure across recent control cases warrants a support report. Success on another feed alone does not prove the original provider is at fault.

Check plan access and contract history separately

Verify the limitation in the mode you are using before buying anything. Platform subscriptions do not include every exchange real-time data fee. A data purchase addresses the stated entitlement; it is not evidence that an older requested interval exists in storage.

  • Replay has special rules for synthetic futures, including continuous contracts and certain settlement-close settings. Do not apply the general Replay allowance to those instruments.
  • For continuous futures in Deep Backtesting, TradingView documents a maximum lookback of N × 3 months for an N-second interval and N × 3 years for an N-minute interval. These are measured from today, regardless of the selected end date, and general Deep limits still apply.
  • For a dated contract, verify its own available trading history. Substituting a continuous series may answer a different question because it joins individual contracts. Keep the original contract identifier in the record.
  • Treat an upgrade as relevant only after identifying a specific plan limit and confirming that the desired history exists. Missing stored data and a provider or service problem require different remedies.

Measure what a shorter window or higher interval removes

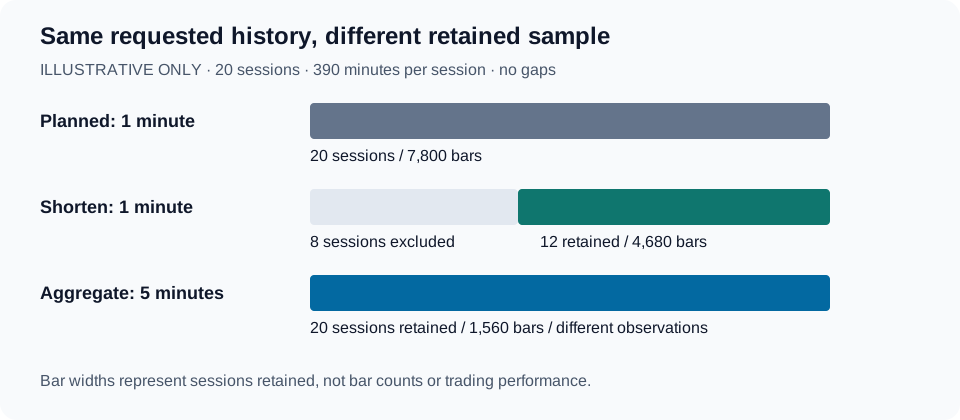
Illustrative worksheet: suppose a planned test contains 20 complete sessions of 390 minutes each. Assume no holidays, breaks, missing bars or partial sessions, with intervals aligned to each session. Only the last 12 sessions are available at one minute; all 20 are available at five minutes. These are invented coverage inputs for arithmetic, not measured TradingView results or plan allowances.

Illustrative comparison of 20 planned sessions, 12 retained one-minute sessions, and 20 retained five-minute sessions with fewer bars.
Illustrative coverage worksheet. Retaining all sessions at five minutes does not retain all one-minute observations. View original source
  • Calculate session retention using retained sessions ÷ planned sessions. Compare bar counts only after naming both intervals; fewer aggregate bars do not mean the same percentage of missing time.
  • A 20-bar lookback represents 20 minutes on a one-minute chart and 100 minutes on a five-minute chart under these assumptions. Holding the input at 20 does not hold the time horizon constant.
  • Keep a separate run identifier for each specification. Recheck signal frequency, fill assumptions, warm-up and transaction costs after a timeframe change; do not relabel the result as the original one-minute test.
Test specificationBars under these assumptionsCoverage change
Planned: 20 sessions at 1 minute20 × 390 = 7,800Reference sample: 20 sessions and 7,800 one-minute observations.
Shorten: 12 sessions at 1 minute12 × 390 = 4,680Retains 60% of planned sessions; excludes 8 sessions and 3,120 one-minute bars (40%).
Aggregate: 20 sessions at 5 minutes20 × (390 ÷ 5) = 1,560Retains all 20 sessions but has 80% fewer bars. Five-minute OHLC does not preserve the ordering of each one-minute move.
Shorten and aggregate: 12 sessions at 5 minutes12 × (390 ÷ 5) = 936Retains 60% of sessions with 88% fewer bars than the planned one-minute test. This is not an 88% loss of calendar coverage.

Preserve the coverage record with the trade export

Once a test runs, save requested dates, actual available dates, calculation warm-up, entry window, interval and excluded sessions alongside the exported trades. The first trade timestamp is not necessarily the first available price bar: the strategy may simply have waited for a signal. A trade CSV alone cannot establish complete price coverage.

  • Export the TradingView strategy trade list for the verified run, then analyze that CSV with Backtest Deep Report. Keep the coverage worksheet beside the report so a shortened sample is visible to anyone comparing runs.
  • For script changes, ask Pine Script AI Coding Agent to make missing inputs and date boundaries explicit. Review those changes against available bars in TradingView; generated logic cannot restore a supplier history gap.
  • If the requested period remains unavailable, state that limitation in the test record. Avoid silently replacing the interval, exchange feed or contract just to obtain a result.
Where Pineify fits

Backtest Deep Report

Analyze the TradingView trade CSV from your verified sample. Keep its coverage record with the report; this tool does not download or repair missing historical candles.

Also useful: Pine Script AI Coding Agent. Review missing-input checks and date boundaries in your script, then verify the behavior on the intended TradingView dataset.

Analyze the Available Trade Sample

Frequently asked questions

Educational troubleshooting reference, not investment advice. The coverage example uses hypothetical inputs. Backtests depend on the available sample and execution assumptions and do not guarantee future performance.

Sources and verification

Published by Pineify. Pineify is an independent product and is not affiliated with TradingView. Sources support the technical explanations; examples do not establish trading performance.