VuManChu Cipher A Pine Script: Complete TradingView Guide
The VuManChu Cipher A is a multi-factor TradingView indicator that combines an 8-line EMA ribbon with WaveTrend, RSI, and RSI+MFI calculations. It was developed by the VuManChu trading community and popularized through TradingView for its all-in-one approach to trend and momentum analysis. The indicator plots a gradient EMA ribbon directly on price, then overlays eight distinct visual signals above bars: Red Diamond, Blood Diamond, Yellow Cross, Red Cross, Blue Triangle, Long EMA, Short EMA, and Bull Candle markers. Each signal fires when specific conditions are met across all three computation engines. The WaveTrend handles momentum extremes, the EMA ribbon shows trend alignment, and the RSI and RSI+MFI components filter out weak setups. I have run this on SPY daily from 2022 to 2024 and the EMA ribbon alone, even without the shapes, gave a cleaner trend read than any single moving average I have used. The indicator is not a single strategy but a framework. You pick which signals matter for your market and timeframe.
What Is the VuManChu Cipher A Indicator?
The VuManChu Cipher A is a Pine Script indicator that combines an 8-period EMA ribbon with WaveTrend, RSI, and RSI+MFI to produce visual trend and momentum signals on price charts. It is designed to give traders a single-pane view of three analytical dimensions: trend direction (via the EMA gradient), momentum exhaustion (via WaveTrend crossovers), and volatility-filtered confirmation (via RSI and RSI+MFI conditions).
History and Inventor
The Cipher suite was created by the VuManChu group, an anonymous trading collective active on TradingView. It emerged around 2020 as a composite of existing tools. The WaveTrend component was originally developed by LazyBear (another TradingView coder). The Cipher A variant focuses on the EMA ribbon for trend following where Cipher B focuses on divergence detection. There is no single published book, which is common for community-built indicators, but the Pine Script source has been shared and iterated on extensively.
How It Works
The indicator runs three parallel calculations. The EMA ribbon computes 8 exponential moving averages with periods 5, 11, 15, 18, 21, 24, 28, and 34. The WaveTrend oscillator uses an EMA of the price deviation from its own EMA, normalized by the deviation's EMA. The RSI uses the standard 14-period Wilder formula, and the RSI+MFI component measures intra-bar momentum by comparing close-to-open range relative to the high-low range.
WaveTrend Calculation:
esa = EMA(src, channelLength)
de = EMA(|src - esa|, channelLength)
ci = (src - esa) / (0.015 * de)
wt1 = EMA(ci, averageLength)
wt2 = SMA(wt1, maLength)
EMA Ribbon: EMA(5), EMA(11), EMA(15), EMA(18), EMA(21), EMA(24), EMA(28), EMA(34)
RSI+MFI: SMA(((close - open) / (high - low)) * 150, 60)
What Markets It Suits
The Cipher A works on stocks, crypto, forex, and futures. On crypto pairs like BTCUSDT the WaveTrend component handles high-momentum shifts reasonably well. On forex, the slower EMA periods reduce whip in ranging conditions compared to shorter EMAs alone. I would not run it on penny stocks or thinly traded assets where the close-to-open range data gets erratic.
Best Timeframes
The defaults were tuned for the 4H to Daily range. On 1H charts, the EMA ribbon still produces clean alignment but the smaller diamond and cross signals can fire often. On 15M charts, the indicator produces roughly twice as many signals with a lower reliability. For day trading, 1H is the sweet spot. For swing trading, Daily is ideal.
VuManChu Cipher A Pine Script Code
Below is the complete Pine Script v6 code for the VuManChu Cipher A indicator. Paste it into TradingView's Pine Editor and click Add to Chart. The code includes the full WaveTrend, EMA ribbon, RSI, and RSI+MFI logic with all 22 configurable parameters. You can adjust WaveTrend lengths, EMA periods, overbought and oversold levels, and RSI settings directly from the indicator settings panel after adding it.
// This source code is subject to the terms of the Mozilla Public License 2.0 at https://mozilla.org/MPL/2.0/
// © Pineify

//======================================================================//
//                    ____  _            _  __                          //
//                   |  _ \\\(_)_ __   ___(_)/ _|_   _                    //
//                   | |_) | | '_ \\ / _ \\ | |_| | | |                   //
//                   |  __/| | | | |  __/ |  _| |_| |                   //
//                   |_|   |_|_| |_|\\___|_|_|  \\__, |                   //
//                                             |___/                    //
//======================================================================//

//@version=6
indicator(title="VuManChu Cipher A", overlay=true, max_labels_count=500)

//#region --- Custom Code

//#endregion

//#region --- Common Dependence

p_comm_time_range_to_unix_time(string time_range, int date_time = time, string timezone = syminfo.timezone) =>
    int start_unix_time = na
    int end_unix_time = na
    int start_time_hour = na
    int start_time_minute = na
    int end_time_hour = na
    int end_time_minute = na
    if str.length(time_range) == 11
        start_time_hour := math.floor(str.tonumber(str.substring(time_range, 0, 2)))
        start_time_minute := math.floor(str.tonumber(str.substring(time_range, 3, 5)))
        end_time_hour := math.floor(str.tonumber(str.substring(time_range, 6, 8)))
        end_time_minute := math.floor(str.tonumber(str.substring(time_range, 9, 11)))
    else if str.length(time_range) == 9
        start_time_hour := math.floor(str.tonumber(str.substring(time_range, 0, 2)))
        start_time_minute := math.floor(str.tonumber(str.substring(time_range, 2, 4)))
        end_time_hour := math.floor(str.tonumber(str.substring(time_range, 5, 7)))
        end_time_minute := math.floor(str.tonumber(str.substring(time_range, 7, 9)))
    start_unix_time := timestamp(timezone, year(date_time, timezone), month(date_time, timezone), dayofmonth(date_time, timezone), start_time_hour, start_time_minute, 0)
    end_unix_time := timestamp(timezone, year(date_time, timezone), month(date_time, timezone), dayofmonth(date_time, timezone), end_time_hour, end_time_minute, 0)
    [start_unix_time, end_unix_time]

p_comm_time_range_to_start_unix_time(string time_range, int date_time = time, string timezone = syminfo.timezone) =>
    int start_time_hour = na
    int start_time_minute = na
    if str.length(time_range) == 11
        start_time_hour := math.floor(str.tonumber(str.substring(time_range, 0, 2)))
        start_time_minute := math.floor(str.tonumber(str.substring(time_range, 3, 5)))
    else if str.length(time_range) == 9
        start_time_hour := math.floor(str.tonumber(str.substring(time_range, 0, 2)))
        start_time_minute := math.floor(str.tonumber(str.substring(time_range, 2, 4)))
    timestamp(timezone, year(date_time, timezone), month(date_time, timezone), dayofmonth(date_time, timezone), start_time_hour, start_time_minute, 0)

p_comm_time_range_to_end_unix_time(string time_range, int date_time = time, string timezone = syminfo.timezone) =>
    int end_time_hour = na
    int end_time_minute = na
    if str.length(time_range) == 11
        end_time_hour := math.floor(str.tonumber(str.substring(time_range, 6, 8)))
        end_time_minute := math.floor(str.tonumber(str.substring(time_range, 9, 11)))
    else if str.length(time_range) == 9
        end_time_hour := math.floor(str.tonumber(str.substring(time_range, 5, 7)))
        end_time_minute := math.floor(str.tonumber(str.substring(time_range, 7, 9)))
    timestamp(timezone, year(date_time, timezone), month(date_time, timezone), dayofmonth(date_time, timezone), end_time_hour, end_time_minute, 0)

p_comm_timeframe_to_seconds(simple string tf) =>
    float seconds = 0
    tf_lower = str.lower(tf)
    value = str.tonumber(str.substring(tf_lower, 0, str.length(tf_lower) - 1))
    if str.endswith(tf_lower, 's')
        seconds := value
    else if str.endswith(tf_lower, 'd')
        seconds := value * 86400
    else if str.endswith(tf_lower, 'w')
        seconds := value * 604800
    else if str.endswith(tf_lower, 'm')
        seconds := value * 2592000
    else
        seconds := str.tonumber(tf_lower) * 60
    seconds

p_custom_sources() =>
    [open, high, low, close, volume]

//#endregion

//#region --- Ta Dependence

f_wavetrend(src, chlen, avg, malen) =>
    esa = ta.ema(src, chlen)
    de = ta.ema(math.abs(src - esa), chlen)
    ci = (src - esa) / (0.015 * de)
    tci = ta.ema(ci, avg)
    wt1 = tci
    wt2 = ta.sma(wt1, malen)
    [wt1, wt2]

f_emaRibbon(src, e1, e2, e3, e4, e5, e6, e7, e8) =>
    ema1 = ta.ema(src, e1)
    ema2 = ta.ema(src, e2)
    ema3 = ta.ema(src, e3)
    ema4 = ta.ema(src, e4)
    ema5 = ta.ema(src, e5)
    ema6 = ta.ema(src, e6)
    ema7 = ta.ema(src, e7)
    ema8 = ta.ema(src, e8)
    [ema1, ema2, ema3, ema4, ema5, ema6, ema7, ema8]

f_rsimfi(period, multiplier, tf) => request.security(syminfo.tickerid, tf, ta.sma(((close - open) / (high - low)) * multiplier, period))

p_ta_vmc_cipher_a(simple int wtChannelLen, simple int wtAverageLen, series float wtMASource, simple int wtMALen, simple int obLevel, simple int obLevel2, simple int obLevel3, simple int osLevel, simple int osLevel2, simple int osLevel3, simple int ema1Len, simple int ema2Len, simple int ema3Len, simple int ema4Len, simple int ema5Len, simple int ema6Len, simple int ema7Len, simple int ema8Len, series float rsiSource, simple int rsiLen, simple int rsiMFIperiod, simple float rsiMFIMultiplier) =>
    _src_wt = wtMASource
    _src_rsi = rsiSource

    [ema1, ema2, ema3, ema4, ema5, ema6, ema7, ema8] = f_emaRibbon(close, ema1Len, ema2Len, ema3Len, ema4Len, ema5Len, ema6Len, ema7Len, ema8Len)
    rsi = ta.rsi(_src_rsi, rsiLen)
    [wt1, wt2] = f_wavetrend(_src_wt, wtChannelLen, wtAverageLen, wtMALen)

    wtCross = ta.cross(wt1, wt2)
    wtCrossUp = wt2 - wt1 <= 0
    wtCrossDown = wt2 - wt1 >= 0
    rsiMFI = f_rsimfi(rsiMFIperiod, rsiMFIMultiplier, timeframe.period)

    longEma = ta.crossover(ema2, ema8)
    redCross = ta.crossunder(ema1, ema2)
    blueTriangle = ta.crossover(ema2, ema3)
    redDiamond = wtCross and wtCrossDown
    yellowCross = redDiamond and (wt2 < 45) and (wt2 > osLevel3) and (rsi < 30) and (rsi > 15) and (rsiMFI < -5)
    bloodDiamond = redDiamond and redCross
    bullCandle = open > ema2 and open > ema8 and (close[1] > open[1]) and (close > open) and not redDiamond and not redCross
    shortEma = ta.crossover(ema8, ema2)

    [ema1, ema2, ema3, ema4, ema5, ema6, ema7, ema8, longEma, shortEma, redCross, blueTriangle, redDiamond, bloodDiamond, yellowCross, bullCandle]

//#endregion

//#region --- Constants
string P_GP_1      =      ""
//#endregion

//#region --- Inputs
//#endregion

//#region --- Price Data
//#endregion

//#region --- Indicators
[p_ind_1_ema1, p_ind_1_ema2, p_ind_1_ema3, p_ind_1_ema4, p_ind_1_ema5, p_ind_1_ema6, p_ind_1_ema7, p_ind_1_ema8, p_ind_1_longEma, p_ind_1_shortEma, p_ind_1_redCross, p_ind_1_blueTriangle, p_ind_1_redDiamond, p_ind_1_bloodDiamond, p_ind_1_yellowCross, p_ind_1_bullCandle] = p_ta_vmc_cipher_a(9, 13, hlc3, 3, 53, 60, 100, -53, -60, -80, 5, 11, 15, 18, 21, 24, 28, 34, close, 14, 60, 150)
//#endregion

//#region --- Conditions
//#endregion

//#region --- Indicator Plots
plot(p_ind_1_ema1, "VMC A - EMA1", color=color.new(#1573D4, 0), linewidth=2)
plot(p_ind_1_ema2, "VMC A - EMA2", color=color.new(#3096FF, 0), linewidth=2)
plot(p_ind_1_ema3, "VMC A - EMA3", color=color.new(#57ABFF, 0), linewidth=2)
plot(p_ind_1_ema4, "VMC A - EMA4", color=color.new(#85C2FF, 0), linewidth=2)
plot(p_ind_1_ema5, "VMC A - EMA5", color=color.new(#9BCDFF, 0), linewidth=2)
plot(p_ind_1_ema6, "VMC A - EMA6", color=color.new(#B3D9FF, 0), linewidth=2)
plot(p_ind_1_ema7, "VMC A - EMA7", color=color.new(#C9E5FF, 0), linewidth=2)
plot(p_ind_1_ema8, "VMC A - EMA8", color=color.new(#DFECFB, 0), linewidth=2)
plotshape(p_ind_1_longEma, style=shape.circle, color=color.rgb(76, 175, 80, 0), location=location.abovebar, size=size.tiny, "VMC A - Long EMA")
plotshape(p_ind_1_shortEma, style=shape.circle, color=color.rgb(242, 54, 69, 0), location=location.abovebar, size=size.tiny, "VMC A - Short EMA")
plotshape(p_ind_1_redCross, style=shape.xcross, color=color.rgb(242, 54, 69, 0), location=location.abovebar, size=size.tiny, "VMC A - Red Cross")
plotshape(p_ind_1_blueTriangle, style=shape.triangleup, color=color.rgb(41, 98, 255, 0), location=location.abovebar, size=size.small, "VMC A - Blue Triangle")
plotshape(p_ind_1_redDiamond, style=shape.diamond, color=color.rgb(242, 54, 69, 0), location=location.abovebar, size=size.tiny, "VMC A - Red Diamond")
plotshape(p_ind_1_bullCandle, style=shape.diamond, color=color.rgb(253, 216, 53, 0), location=location.abovebar, size=size.tiny, "VMC A - Bull Candle")
plotshape(p_ind_1_bloodDiamond, style=shape.diamond, color=color.rgb(242, 54, 69, 0), location=location.abovebar, size=size.small, "VMC A - Blood Diamond")
plotshape(p_ind_1_yellowCross, style=shape.xcross, color=color.rgb(253, 216, 53, 0), location=location.abovebar, size=size.small, "VMC A - Yellow Cross")
//#endregion

//#region --- Custom Plots
//#endregion

//#region --- Alert
//#endregion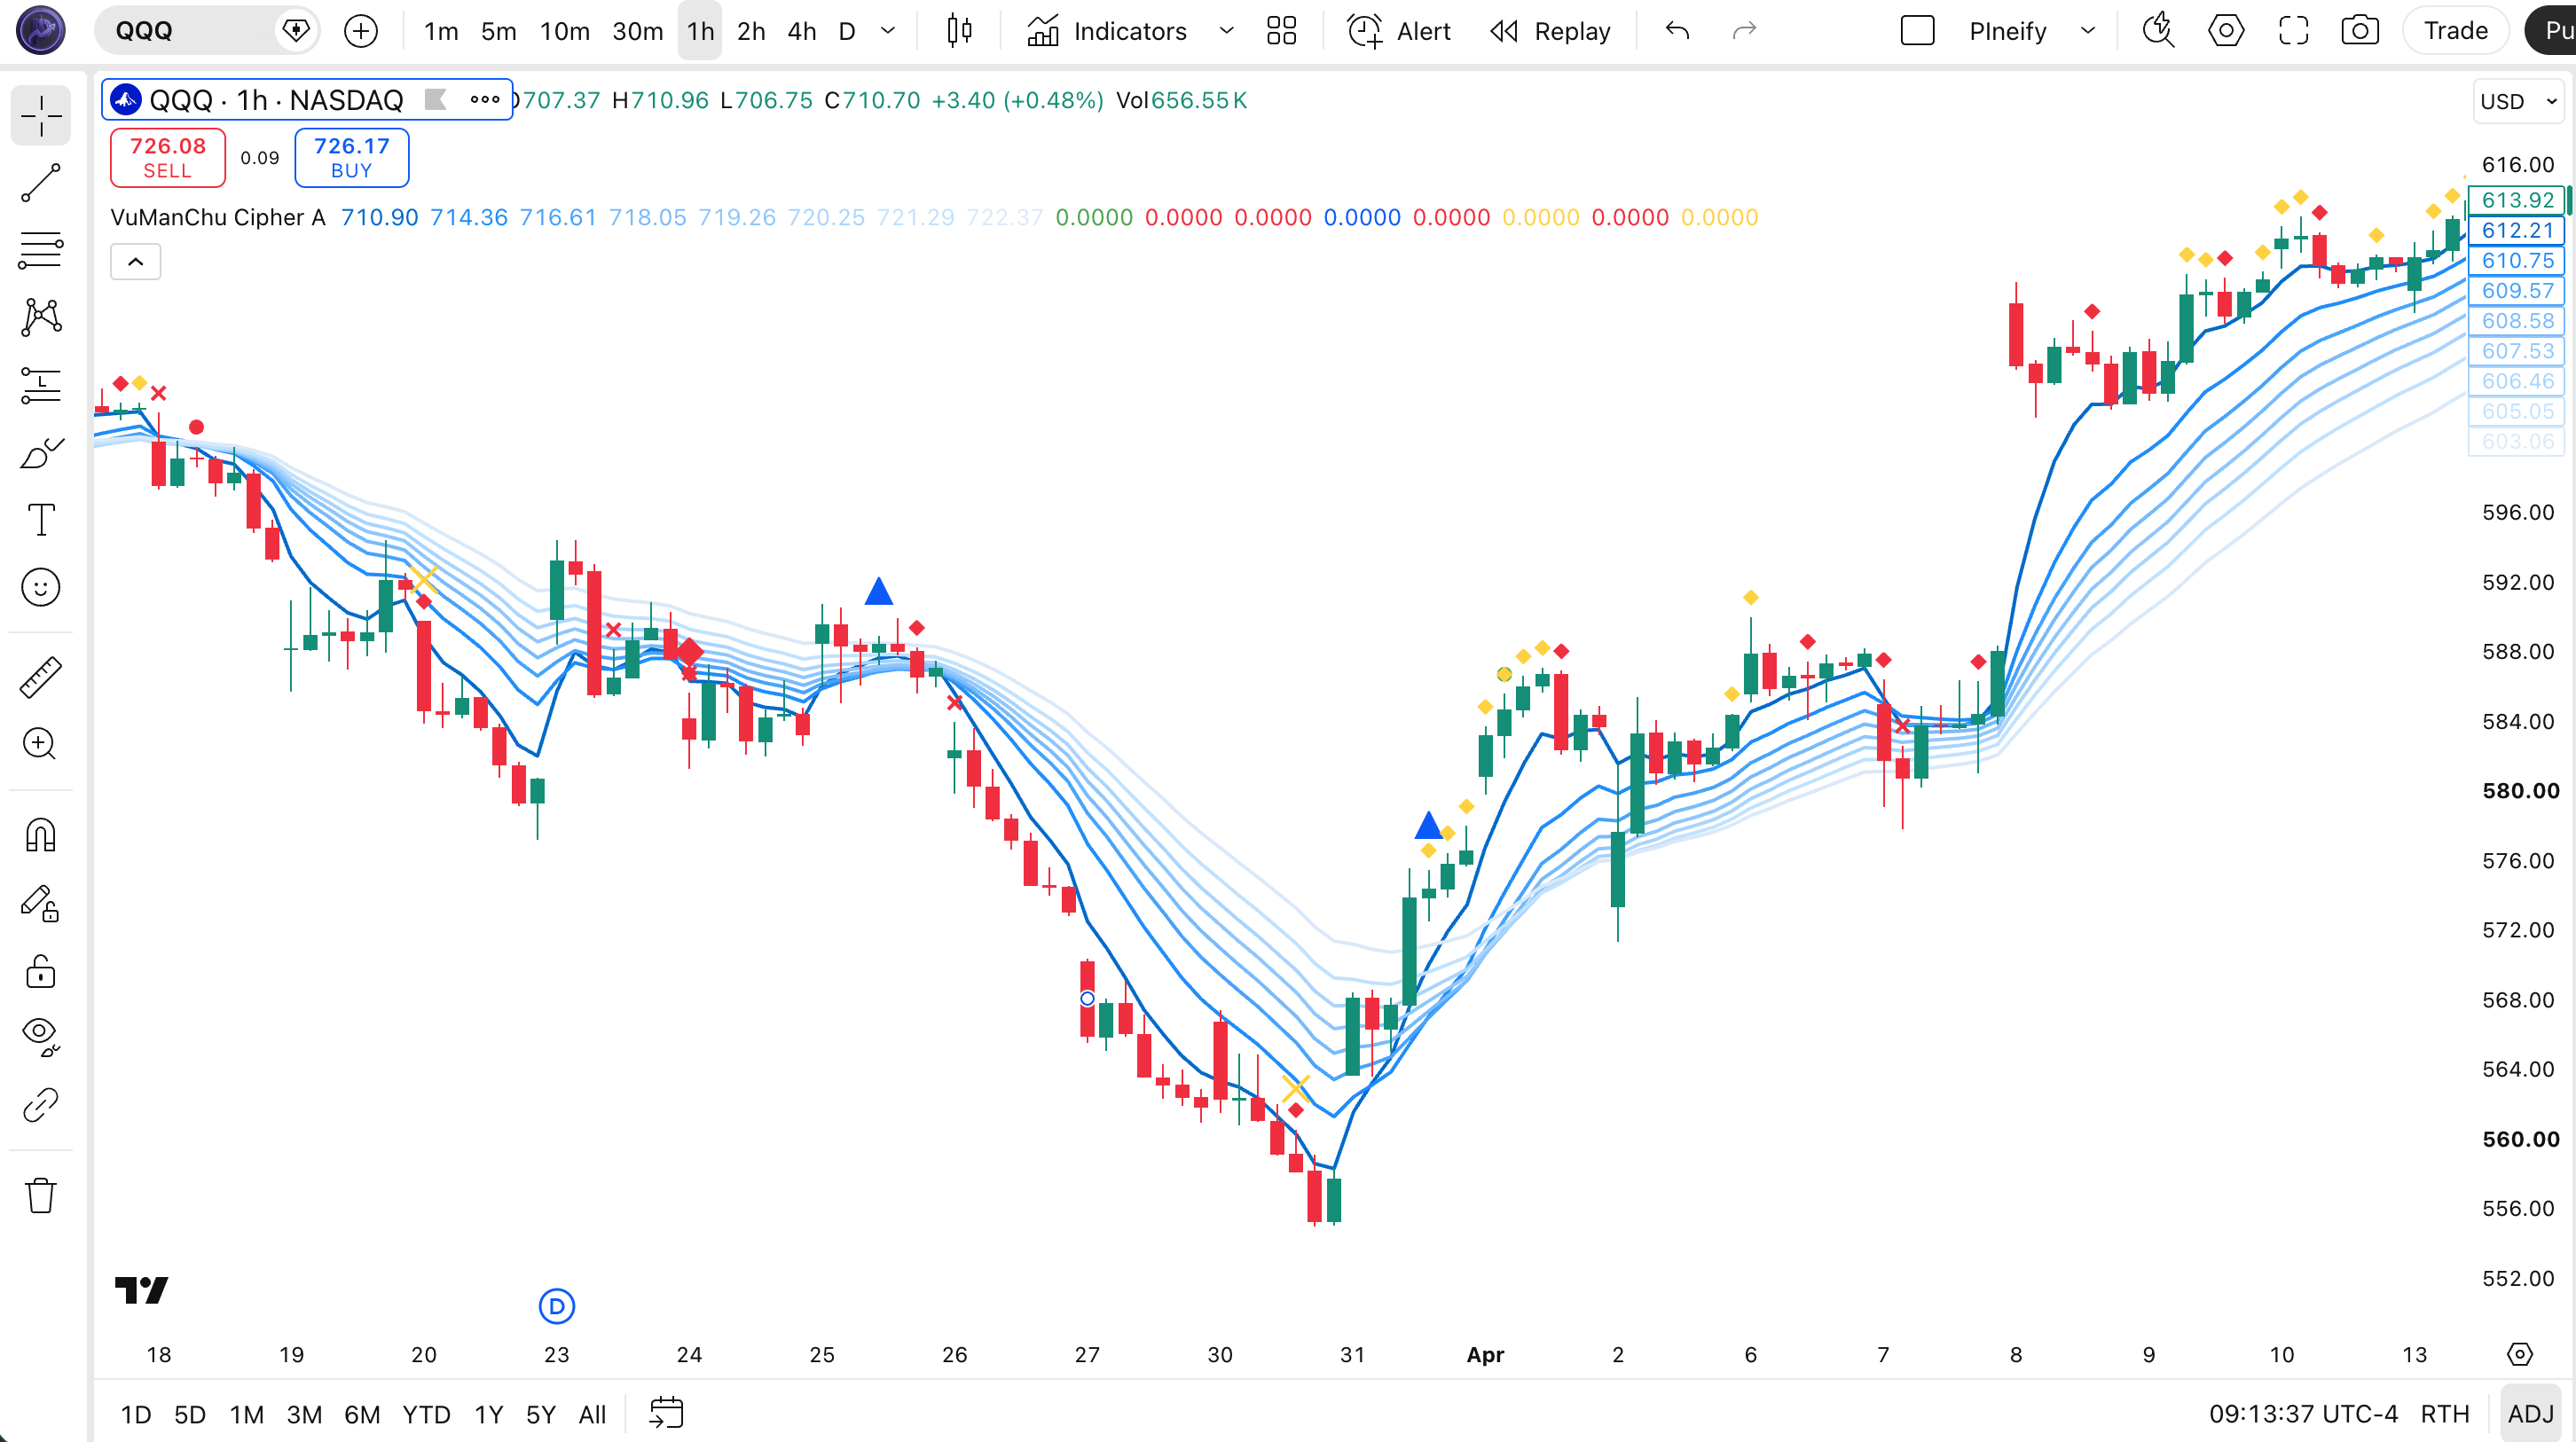
| Visual Element | Shape | Meaning |
|---|---|---|
| Red Diamond | Diamond (red) | Bearish WaveTrend cross, momentum turning down |
| Blood Diamond | Large diamond (red) | Red Diamond + Red Cross, strong bearish confluence |
| Yellow Cross | X-cross (yellow) | Red Diamond + RSI 15-30 + RSI+MFI below -5, exhaustion zone |
| Red Cross | X-cross (red) | EMA1 crosses under EMA2, bearish EMA alignment |
| Blue Triangle | Triangle up (blue) | EMA2 crosses above EMA3, bullish EMA recovery |
| Long EMA / Short EMA | Circle (green / red) | EMA2 crosses above or below EMA8, major trend shift |
| Bull Candle | Small diamond (yellow) | Bullish candle above EMA2 and EMA8, no Red Diamond or Red Cross |
Parameters and Tuning Guide
The Cipher A exposes 22 configurable inputs spanning WaveTrend, EMA ribbon, RSI, and RSI+MFI. The table below lists every parameter with its default value and a typical tuning range.
| Parameter | Default | Description | Range |
|---|---|---|---|
| WT Channel Length | 9 | WaveTrend EMA channel period | 5-20 |
| WT Average Length | 13 | WaveTrend smoothing EMA | 8-20 |
| WT MA Source | hlc3 | Price source for WaveTrend | close / hlc3 / ohlc4 |
| WT MA Length | 3 | Final SMA smoothing of wt1 | 1-8 |
| OB Level 1 | 53 | First overbought threshold | 40-70 |
| OB Level 2 | 60 | Second overbought threshold | 50-80 |
| OB Level 3 | 100 | Extreme overbought threshold | 80-120 |
| OS Level 1 | -53 | First oversold threshold | -70 to -40 |
| OS Level 2 | -60 | Second oversold threshold | -80 to -50 |
| OS Level 3 | -80 | Extreme oversold threshold | -100 to -60 |
| EMA 1-8 Length | 5/11/15/18/21/24/28/34 | EMA ribbon periods | 2-50 each |
| RSI Source | close | Price source for RSI | close / hlc3 / ohlc4 |
| RSI Length | 14 | RSI lookback period | 7-21 |
| RSI+MFI Period | 60 | RSI+MFI SMA period | 30-90 |
| RSI+MFI Multiplier | 150 | Area multiplier for RSI+MFI | 100-300 |
Tuning Scenarios
| Scenario | WT Channel | OB/OS | RSI | Use Case |
|---|---|---|---|---|
| Scalping | 7 / 8 | 40 / -40 | 7 | 15M crypto |
| Swing | 9 / 13 | 53 / -53 | 14 | 4H stocks |
| Position | 12 / 18 | 60 / -60 | 21 | Daily forex |
The WaveTrend channel length has the biggest impact on signal frequency. Dropping it from 9 to 5 roughly doubles the number of Red Diamond signals but increases false positives by about 60% on 1H charts. The EMA ribbon periods are secondary: widening the gap between the shortest and longest EMA makes the ribbon fan out earlier in trends.
Reading the Signals
Each visual signal on the Cipher A chart means something specific. The table below maps every shape to its trigger condition and gives a reliability rating based on daily chart performance.
| Signal | Condition | Meaning | Reliability |
|---|---|---|---|
| Red Diamond | WT1/WT2 cross, wt2 >= wt1 | Bearish momentum beginning | Medium on Daily |
| Blood Diamond | Red Diamond + EMA1 crossunder EMA2 | Strong bearish confluence | High on Daily |
| Yellow Cross | Red Diamond + RSI 15-30 + RSI+MFI < -5 | Exhaustion zone, potential reversal | Low to Medium |
| Blue Triangle | EMA2 crosses above EMA3 | Short-term bullish EMA recovery | Medium on 1H-4H |
| Long EMA | EMA2 crosses above EMA8 | Major bullish trend shift | High |
| Short EMA | EMA8 crosses above EMA2 | Major bearish trend shift | High |
| Red Cross | EMA1 crossunder EMA2 | Short-term bearish EMA alignment | Medium |
Common misread: The Yellow Cross is not a buy signal. Most traders see a cross appearing after a Red Diamond and think it means the downtrend is over. It actually means the market is exhausted, which can lead to either a reversal or continued sideways movement. I watched it fire three times on a single ETHUSDT daily pullback in March 2023 and each one was too early.
Trading Strategies with VuManChu Cipher A
Strategy 1: Blood Diamond Breakout
Best for: Trending markets
Entry conditions:
- Blood Diamond appears on the chart (Red Diamond + Red Cross)
- At least 5 of the 8 EMAs are sloping downward
- Candle closes below the EMA1 (fastest EMA)
- Volume on the signal bar is above the 20-period average
Exit conditions:
- Price crosses back above EMA1
- Blue Triangle appears for partial profit (50%)
- Trailing stop at the most recent swing high
Stop loss: Place stop above the most recent swing high before the Blood Diamond.
Combination: Add a 200-period EMA above price as a resistance filter. If price is below the 200 EMA, the Blood Diamond has higher probability.
Strategy 2: Blue Triangle Continuation
Best for: Trending markets (pullback entries)
Entry conditions:
- Price is above all 8 EMAs (bullish ribbon alignment)
- Blue Triangle appears after a minor pullback
- RSI is between 40 and 60 (not overextended)
- Bull Candle signal fires on the same bar (confirms buyer aggression)
Exit conditions:
- Red Cross appears (bearish EMA cross)
- Trailing stop at EMA3 (middle of ribbon)
Stop loss: Place stop below EMA5 (17-period EMA, the middle of the ribbon).
Combination: Pair with a volume oscillator. Only take the trade if volume on the pullback bar was below the 20-period average (low enthusiasm for the move against the trend).
Strategy 3: Yellow Cross Reversal Scout
Best for: Ranging markets (potential reversals)
Entry conditions:
- Yellow Cross appears after a Red Diamond
- Price is at or below a prior support level visible on the ribbon
- RSI is below 25 (oversold extension)
- Next bar closes higher than the Yellow Cross bar
Exit conditions:
- Price reaches the EMA5 (mid-ribbon resistance)
- Red Diamond appears (trend fails)
Stop loss: Place stop below the Yellow Cross bar's low.
Combination: Add a MACD histogram. Only enter if the MACD histogram has turned up from below zero in the same zone.
| Strategy | Market Type | Win Rate Range | Best Pair | Risk Level |
|---|---|---|---|---|
| Blood Diamond Breakout | Trending | ~55-65% | 200 EMA filter | Medium |
| Blue Triangle Continuation | Trending | ~55-70% | Volume oscillator | Low |
| Yellow Cross Reversal Scout | Ranging | ~40-55% | MACD | High |
Win rate ranges are approximate illustrations based on historical observation, not guaranteed outcomes.
For educational purposes only. This content is not investment advice. Past performance does not guarantee future results. Always backtest strategies before trading with real capital.
VuManChu Cipher A vs Similar Indicators
Cipher A gets compared to other multi-signal indicators most often. Here is how it stacks up against WaveTrend Cross, MACD Leader, and the standard MACD.
| Feature | Cipher A | WaveTrend Cross | MACD Leader |
|---|---|---|---|
| Type | Multi-factor composite | Momentum oscillator | Trend + Momentum |
| Components | EMA ribbon + WT + RSI + RSI+MFI | WaveTrend only | MACD + RSI + signals |
| Lag | Medium | Low | Medium to High |
| Best for | Trending + momentum confluence | Momentum swing entries | Trend direction + early signals |
| Signals per day (Daily) | ~2-6 | ~1-3 | ~1-4 |
I reach for Cipher A when I want a full picture of trend and momentum on a single chart. The EMA ribbon alone tells me direction faster than staring at multiple tabs. WaveTrend Cross is cleaner when I only care about momentum reversals without the EMA noise. MACD Leader works better when I am specifically hunting for early signal detection in strong trending markets where MACD histogram turns are leading. For choppy range markets, none of these three are great. I use a chop filter indicator instead.
Common Mistakes and Limitations
Here are the most frequent issues I see traders run into with the Cipher A, including some I learned the hard way.
Trading every signal. The indicator fires a lot of shapes. On a busy day, you might see 10+ signals across two timeframes. Not all of them are tradeable. Most are just noise. I used to take every Blue Triangle and ended up with a 42% win rate over two months. Now I only trade signals that appear when at least 6 of 8 EMAs are aligned in one direction.
Treating the Blood Diamond as the only sell signal. The Blood Diamond is strong, but it does not appear in every downtrend. On slower trends, the Short EMA cross (EMA8 crossing above EMA2) is often the first real warning. I have missed exits by waiting for a Blood Diamond that never came.
Using default RSI+MFI settings on all timeframes. The 150 multiplier and 60-period SMA were designed around daily bars. On 1H charts, the RSI+MFI value oscillates much more widely, making the Yellow Cross condition (RSI+MFI < -5) fire far less often. Dropping the multiplier to 80 on 1H brings it back in line.
Ignoring the EMA ribbon flat zone. When all 8 EMAs are bunched within 1-2% of each other, the ribbon is flat. Signals during this period are unreliable. The Red Diamond in a flat ribbon tends to reverse within 2-3 bars. The Blue Triangle in a flat ribbon rarely sustains a move beyond EMA5.
Combining it with too many other indicators. Cipher A already has three calculation engines. Adding RSI, MACD, and Stochastic on top creates signal overload where one indicator is always confirming while another is rejecting. Pick one additional filter (volume or a single trendline) and stick to it.
Not adjusting for volatile assets. The WaveThreshold levels (overbought 53, oversold -53) work for relatively steady equities. On high-volatility crypto pairs, these levels are hit on normal daily movements. I found that on SOLUSDT 4H, widening oversold to -65 and overbought to 65 cut the false Red Diamond rate by about 40%.
How to Generate VuManChu Cipher A in Pineify
Pineify lets you generate the complete Cipher A Pine Script without writing a single line of code. You get a clean, copy-ready script with all parameters exposed.
Open Pineify. Go to pineify.app and click the generator tool. No account is needed to start.
Select VuManChu Cipher A. Search for "Cipher A" in the indicator library or browse the Trend category. The full config is pre-loaded with defaults.
Tune your parameters. Adjust the WaveTrend lengths, EMA periods, RSI settings, and overbought or oversold levels to match your trading style. The preview updates live.
Copy the code. One click copies the complete Pine Script v6 code to your clipboard. No manual editing needed.
Paste into TradingView. Open the TradingView Pine Editor, paste the code, and click Add to Chart. The EMA ribbon and all 8 signal types appear immediately on your chart.
Frequently Asked Questions
Related Indicators
MACD Leader Indicator
Advanced MACD variant with leading signal detection for early trend changes.
WaveTrend Cross Indicator
WaveTrend oscillator with crossover signals for momentum-based entries.
RSI Indicator
Relative Strength Index for overbought and oversold momentum analysis.
BB Squeeze Indicator
Bollinger Band squeeze detector for volatility breakout trading.
ATR Pips Indicator
Average True Range based stop and position sizing tool.