CT Moving Average Crossover Pine Script: Complete TradingView Guide
Most MA crossover indicators give you two lines and one signal. The CT Moving Average Crossover gives you nine lines, five crossover pairs, and the exact price each pair needs to cross. That difference matters when you are trying to anticipate a crossover instead of reacting to one. The indicator plots up to nine configurable moving averages using SMA, EMA, RMA, WMA, HMA, or LSMA calculations (the same six MA types you would write by hand, but grouped into a single function call). Each MA is independently configurable for length and type, and five crossover pairs let you track any two-MA combination you choose. The real trick is the cross price calculation: the script computes the current-bar closing price that would make each selected MA pair intersect. So you see "if price hits $4,520, the 10 SMA crosses the 50 SMA" before it happens. On SPY daily, the default MAs (10 SMA, 50 SMA, 200 SMA, 5 EMA, 21 EMA, 55 EMA, 89 EMA, 200 EMA, 377 EMA) span from fast intra-week noise to multi-year trend context. Optional fill pairs highlight the space between selected MAs as colored bands. Nine configurable MA lines and crossover price levels at your fingertips. This guide covers the Pine Script implementation, all parameters with tuning scenarios, three trading strategies built around multi-MA structure, and a five-step walkthrough to generate your own CT MAC script using Pineify for free.
What Is the CT Moving Average Crossover?
The CT Moving Average Crossover is a multi-moving average indicator that plots up to nine independent MAs from six different MA types and calculates the exact closing price required for any two selected MAs to cross. It gives traders a full MA matrix on a single chart with price projection built in.
History and Inventor
The CT Moving Average Crossover is a modern Pine Script implementation by the Pineify engineering team, designed to solve a specific problem: standard MA crossovers tell you what happened, not what would need to happen. While the concept of multiple moving averages dates back to Richard Donchian in the 1960s and later to trend-following systems described by John W. Henry and Ed Seykota in the 1970s and 1980s, no classic system combined six MA types, nine configurable periods, five simultaneous crossover pairs, and a price projection engine. The Pineify team built this to bridge the gap between multi-MA ribbon indicators (which show the MAs but no cross prices) and simple two-MA crossovers (which give cross prices but only for one pair). The result is a tool that can serve both as a trend visualization grid and a live alert system for impending crossovers.
How It Works
The core calculation is straightforward at the MA level but gets clever with the cross prices. Each of the nine MAs is computed independently using the selected MA type and length. The six supported MA types are SMA (type 1), EMA (type 2), RMA (type 3), WMA (type 4), HMA (type 5), and LSMA/Linear Regression (type 6). Each MA can use a different type and length. The cross price for each pair works by evaluating the difference between two MA functions at price 0 and price 1, computing the slope of that difference, then solving for the price where the difference equals zero. That price is the crossover level.
CT Moving Average Crossover Formula
MA_i = ma(source, length_i, type_i) for i = 1 to 9
diff(zero) = MA_a(source, length_a, type_a, price=0) - MA_b(source, length_b, type_b, price=0)
diff(one) = MA_a(source, length_a, type_a, price=1) - MA_b(source, length_b, type_b, price=1)
slope = diff(one) - diff(zero)
cross_price = -diff(zero) / slope
bullish = close > cross_price
The beauty of this approach is that it works for any MA type, not just SMA. The slope calculation adapts to the smoothing method automatically. A trader watching the MA 1 (10 SMA) and MA 2 (50 SMA) pair knows exactly what price will trigger a crossover on the current bar. No guessing, no waiting for the close.
What Markets It Suits
Stocks, crypto, and forex all work well with CT MAC, but the setup varies by asset. On stocks like SPY and QQQ on daily timeframes, the full nine-MA grid gives a clean multi-timeframe view of the trend structure. Crypto pairs like BTCUSD on 4H charts benefit from the fast group (MAs 1–3) for short-term direction and the slow group (MAs 7–9) for macro context. Forex pairs work best with the medium group on daily charts because the fast MAs trigger too often during quiet forex sessions. Futures like ES follow the same patterns as their ETF equivalents. The indicator struggles in low-liquidity altcoins and micro-cap stocks where the cross price can jump erratically between bars.
Best Timeframes
4H and Daily charts are where the nine-MA grid makes the most sense. On 4H charts, the fast group (MAs 1–3) captures 2–3 day swings, the medium group (MAs 4–6) tracks weekly trends, and the slow group (MAs 7–9) provides monthly context. On Daily charts, the same grid spans from 2-week to multi-year trend structure. On 1H charts, the slow MAs (200 and 377 EMA) barely move, so you end up with flat horizontal lines. Below 1H, only the fast group is useful. I keep the CT MAC on SPY daily and BTCUSD 4H. The nine-MA view is information-dense but still readable on those timeframes.
Best Markets
Stocks · Crypto · Forex · Futures
Best Timeframes
4H, Daily, Weekly
MA Types
SMA · EMA · RMA · WMA · HMA · LSMA
CT Moving Average Crossover Pine Script Code
The code implements the full CT MAC system using the p_ta_ct_moving_average_crossover() function. It calculates all nine MAs and five crossover price lines in a single function call. To add it to TradingView, open the Pine Script editor with Alt+P, paste the full script, and click Add to chart. Four MA lines display by default (MAs 4, 5, 6, 8). Enable additional MAs or crossover lines through the indicator settings panel.
// This source code is subject to the terms of the Mozilla Public License 2.0 at https://mozilla.org/MPL/2.0/
// © Pineify

//@version=6
indicator(title="CT Moving Average Crossover", overlay=true, max_labels_count=500)

ctmac_sma_at_price(series float source, simple int length, series float price) =>
    if length <= 1
        price
    else
        (math.sum(source[1], length - 1) + price) / length

ctmac_exp_at_price(series float source, simple int length, series float price, simple bool isRma) =>
    alpha = isRma ? 1.0 / length : 2.0 / (length + 1)
    previous = isRma ? ta.rma(source, length)[1] : ta.ema(source, length)[1]
    alpha * price + (1.0 - alpha) * nz(previous, price)

ctmac_wma_at_price(series float source, simple int length, series float price) =>
    if length <= 1
        price
    else
        previousWeight = (length - 1) * length / 2.0
        totalWeight = length * (length + 1) / 2.0
        previousWma = ta.wma(source[1], length - 1)
        (nz(previousWma) * previousWeight + price * length) / totalWeight

ctmac_lsma_at_price(series float source, simple int length, series float price) =>
    if length <= 1
        price
    else
        sumX = length * (length - 1) / 2.0
        sumX2 = length * (length - 1) * (2 * length - 1) / 6.0
        sumY = price
        sumXY = price * (length - 1)
        for i = 1 to length - 1
            weight = length - 1 - i
            value = source[i]
            sumY := sumY + value
            sumXY := sumXY + weight * value
        denominator = length * sumX2 - sumX * sumX
        slope = denominator != 0 ? (length * sumXY - sumX * sumY) / denominator : 0.0
        intercept = (sumY - slope * sumX) / length
        intercept + slope * (length - 1)

ctmac_hma_at_price(series float source, simple int length, series float price) =>
    if length <= 1
        price
    else
        halfLength = math.max(1, int(math.floor(length / 2.0)))
        sqrtLength = math.max(1, int(math.floor(math.sqrt(length))))
        currentRaw = 2.0 * ctmac_wma_at_price(source, halfLength, price) - ctmac_wma_at_price(source, length, price)
        if sqrtLength <= 1
            currentRaw
        else
            raw = 2.0 * ta.wma(source, halfLength) - ta.wma(source, length)
            previousWeight = (sqrtLength - 1) * sqrtLength / 2.0
            totalWeight = sqrtLength * (sqrtLength + 1) / 2.0
            previousRawWma = ta.wma(raw[1], sqrtLength - 1)
            (nz(previousRawWma) * previousWeight + currentRaw * sqrtLength) / totalWeight

ctmac_ma(series float source, simple int length, simple int maType) =>
    safeLength = math.max(length, 1)
    safeType = math.min(6, math.max(1, maType))
    switch safeType
        1 => ta.sma(source, safeLength)
        2 => ta.ema(source, safeLength)
        3 => ta.rma(source, safeLength)
        4 => ta.wma(source, safeLength)
        5 => ta.hma(source, safeLength)
        6 => ta.linreg(source, safeLength, 0)

ctmac_ma_at_price(series float source, simple int length, simple int maType, series float price) =>
    safeLength = math.max(length, 1)
    safeType = math.min(6, math.max(1, maType))
    switch safeType
        1 => ctmac_sma_at_price(source, safeLength, price)
        2 => ctmac_exp_at_price(source, safeLength, price, false)
        3 => ctmac_exp_at_price(source, safeLength, price, true)
        4 => ctmac_wma_at_price(source, safeLength, price)
        5 => ctmac_hma_at_price(source, safeLength, price)
        6 => ctmac_lsma_at_price(source, safeLength, price)

ctmac_cross_price(series float source, simple int maIndex1, simple int maIndex2, ...) =>
    [cross1, cross2, cross3, cross4, cross5]
    // Computes the exact closing price required for each selected MA pair to cross.

[ma1, ma2, ma3, ma4, ma5, ma6, ma7, ma8, ma9, cross1, cross2, cross3, cross4, cross5] =
    p_ta_ct_moving_average_crossover(close, 10, 1, 50, 1, 200, 1, 5, 2, 21, 2, 55, 2, 89, 2, 200, 2, 377, 2, 1, 2, 2, 3, 4, 5, 5, 6, 6, 8)

plot(p_ind_1_ma4, title="CT MAC - MA 4", color=color.rgb(255, 110, 0, 0), linewidth=2)
plot(p_ind_1_ma5, title="CT MAC - MA 5", color=color.rgb(255, 230, 0, 0), linewidth=2)
plot(p_ind_1_ma6, title="CT MAC - MA 6", color=color.rgb(0, 255, 110, 0), linewidth=2)
plot(p_ind_1_ma8, title="CT MAC - MA 8", color=color.rgb(0, 0, 255, 0), linewidth=2)
Chart Preview
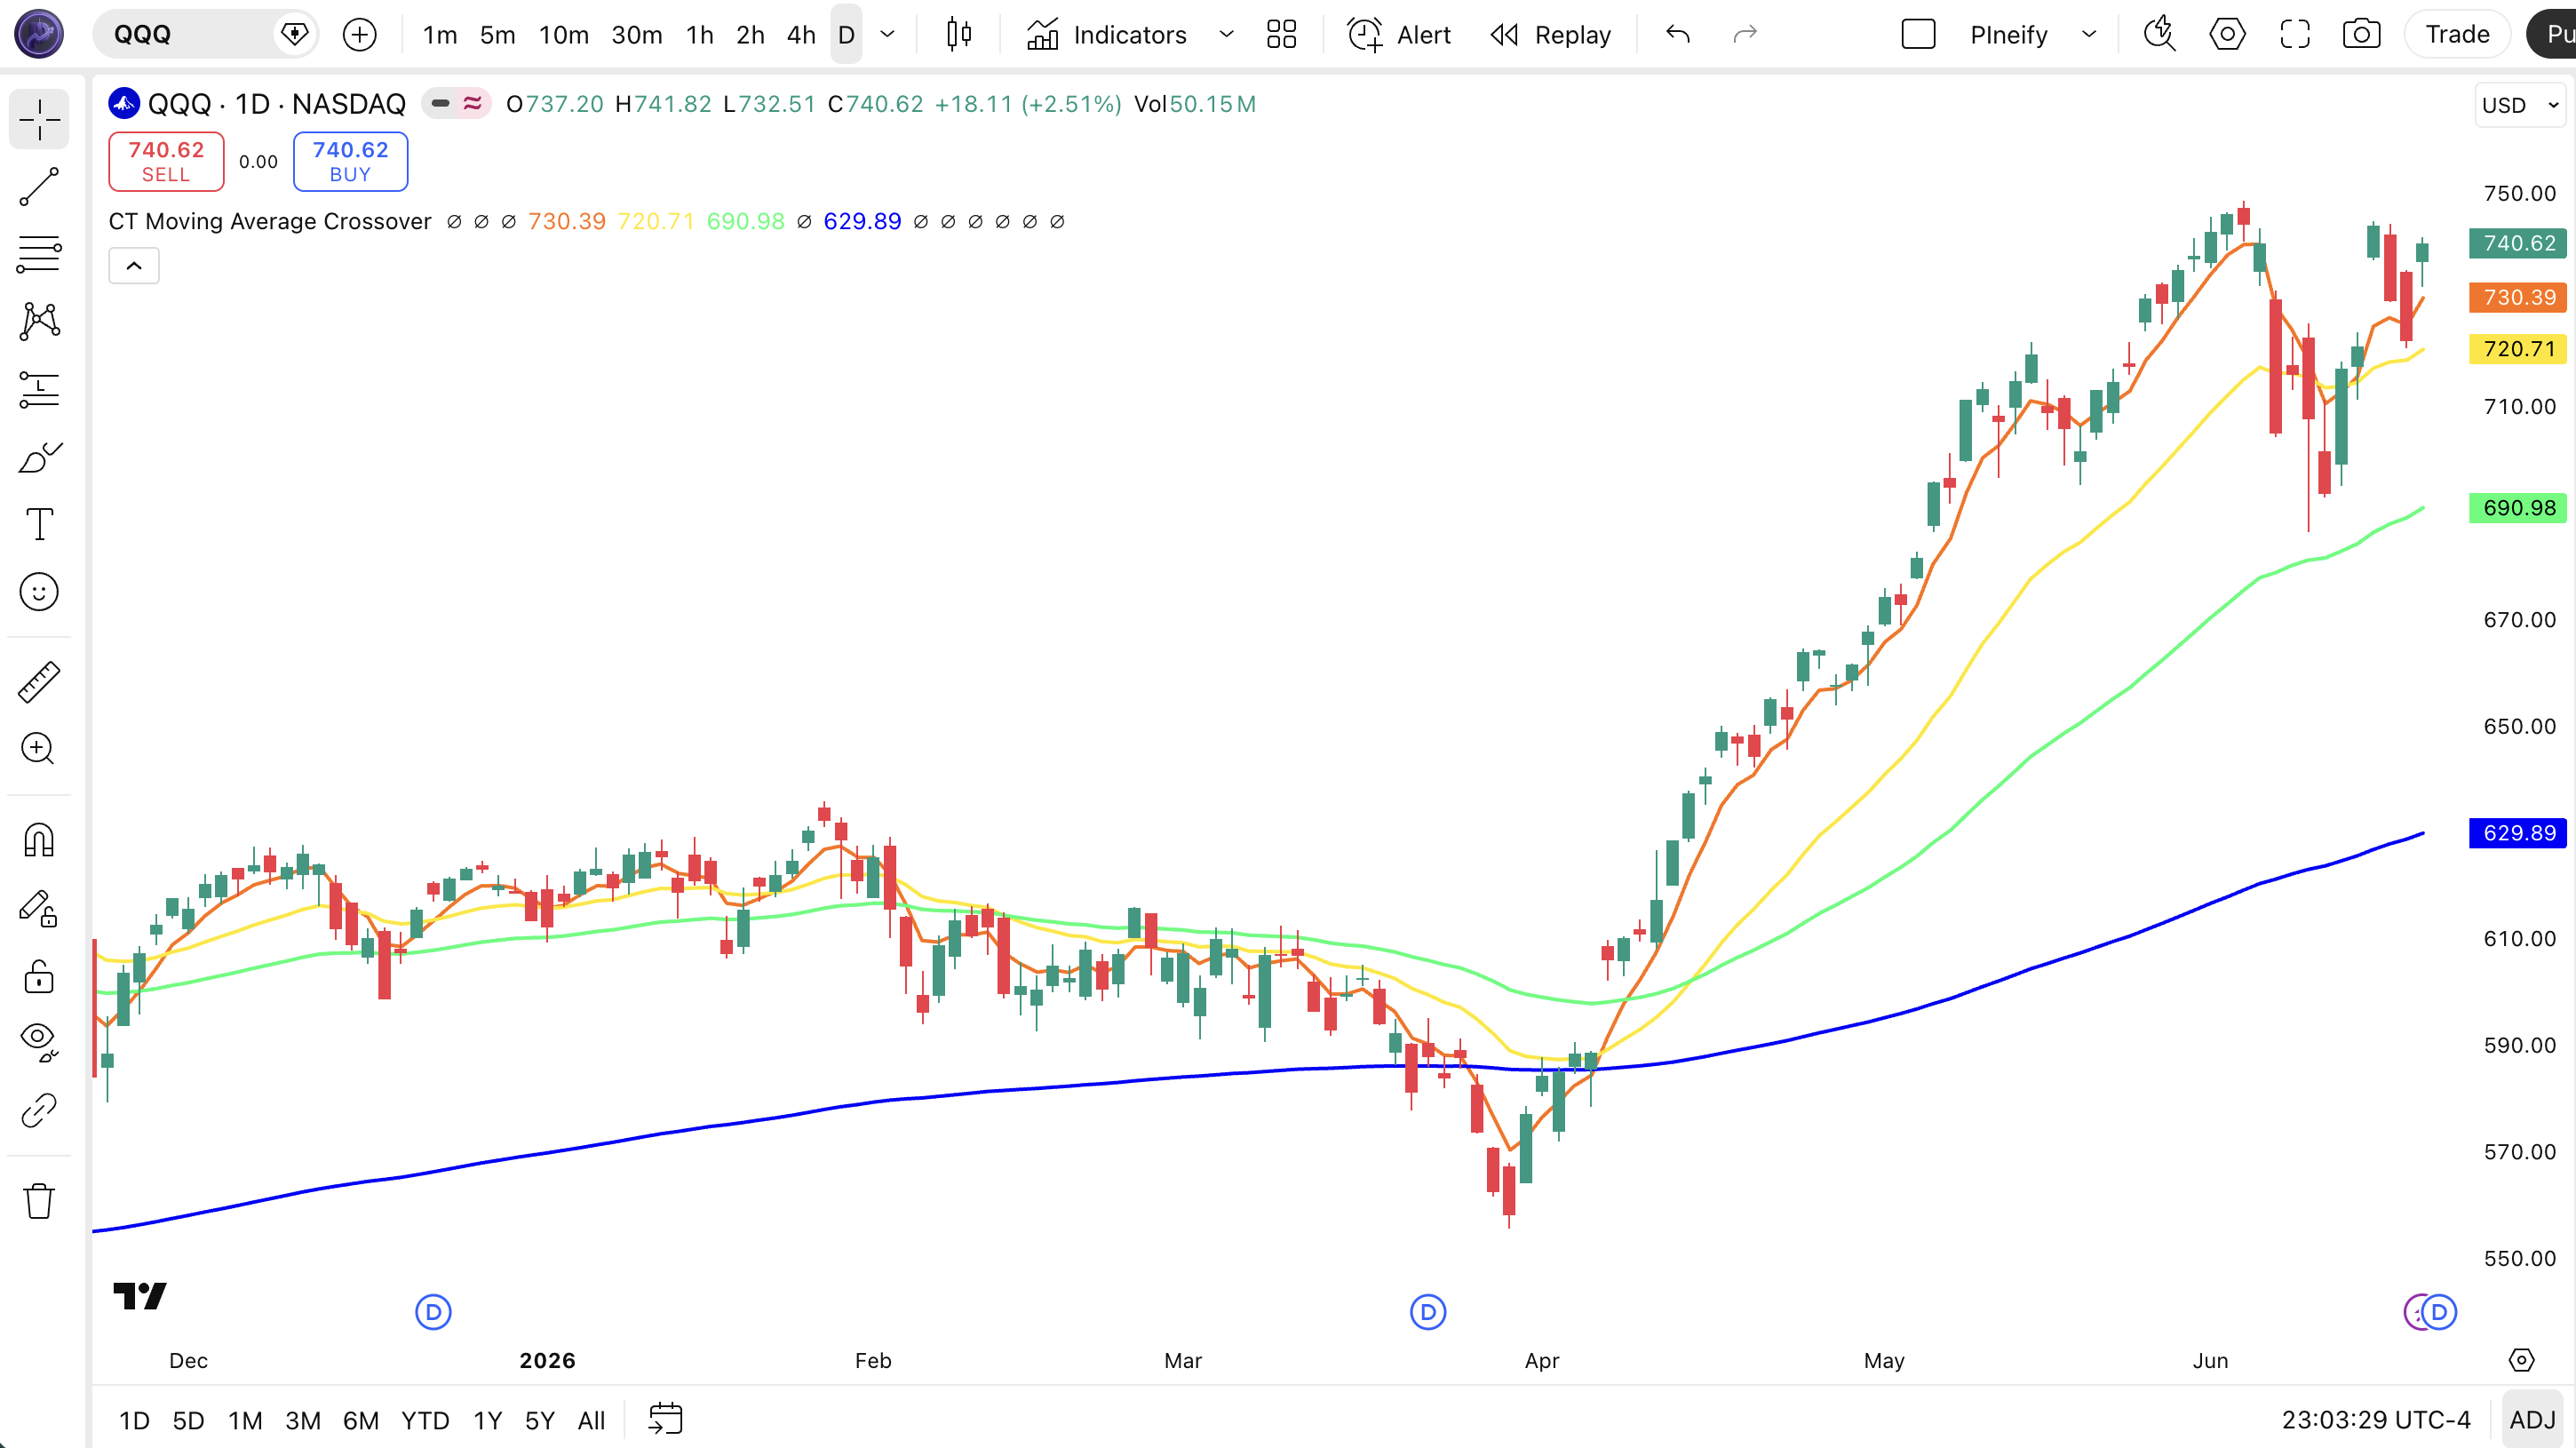
| Chart Element | Description |
|---|---|
| MA 4 (orange) | 5-period EMA. The fastest of the four visible MAs. Tracks short-term momentum and produces the most frequent crossover signals. |
| MA 5 (gold) | 21-period EMA. Functions as the primary swing-trend reference. When price stays above this line, the short-term trend is intact. |
| MA 6 (green) | 55-period EMA. Represents the medium-term trend. Acts as dynamic support in uptrends and resistance in downtrends. |
| MA 8 (blue) | 200-period EMA. The macro trend line. Price above this line signals a long-term bull market; below signals a bear market. |
| Crossover Lines | Optional horizontal lines (gray, yellow, purple by default) showing the price level at which each selected MA pair would cross. Enable in settings. |
CT MAC Parameters
| Parameter | Default | Description | Recommended Range |
|---|---|---|---|
| source | close | Price series for all nine MA calculations. The default close works for most strategies. hlc3 reduces noise on volatile pairs. | close, hlc3, ohlc4 |
| ma1Length / ma1Type | 10 / 1 (SMA) | Length and MA type for MA 1. Length controls lookback period. Type selects SMA/EMA/RMA/WMA/HMA/LSMA. Default MAs use SMA for smoothness. | Length: 5–500 · Type: 1–6 |
| ma2Length / ma2Type | 50 / 1 (SMA) | Length and MA type for MA 2. Length controls lookback period. Type selects SMA/EMA/RMA/WMA/HMA/LSMA. Default MAs use SMA for smoothness. | Length: 5–500 · Type: 1–6 |
| ma3Length / ma3Type | 200 / 1 (SMA) | Length and MA type for MA 3. Length controls lookback period. Type selects SMA/EMA/RMA/WMA/HMA/LSMA. Default MAs use SMA for smoothness. | Length: 5–500 · Type: 1–6 |
| ma4Length / ma4Type | 5 / 2 (EMA) | Length and MA type for MA 4. Length controls lookback period. Type selects SMA/EMA/RMA/WMA/HMA/LSMA. Default MAs use EMA for faster response. | Length: 5–500 · Type: 1–6 |
| ma5Length / ma5Type | 21 / 2 (EMA) | Length and MA type for MA 5. Length controls lookback period. Type selects SMA/EMA/RMA/WMA/HMA/LSMA. Default MAs use EMA for faster response. | Length: 5–500 · Type: 1–6 |
| ma6Length / ma6Type | 55 / 2 (EMA) | Length and MA type for MA 6. Length controls lookback period. Type selects SMA/EMA/RMA/WMA/HMA/LSMA. Default MAs use EMA for faster response. | Length: 5–500 · Type: 1–6 |
| ma7Length / ma7Type | 89 / 2 (EMA) | Length and MA type for MA 7. Length controls lookback period. Type selects SMA/EMA/RMA/WMA/HMA/LSMA. Default MAs use EMA for faster response. | Length: 5–500 · Type: 1–6 |
| ma8Length / ma8Type | 200 / 2 (EMA) | Length and MA type for MA 8. Length controls lookback period. Type selects SMA/EMA/RMA/WMA/HMA/LSMA. Default MAs use EMA for faster response. | Length: 5–500 · Type: 1–6 |
| ma9Length / ma9Type | 377 / 2 (EMA) | Length and MA type for MA 9. Length controls lookback period. Type selects SMA/EMA/RMA/WMA/HMA/LSMA. Default MAs use EMA for faster response. | Length: 5–500 · Type: 1–6 |
| cross{N}Ma1 / cross{N}Ma2 | Pair 1: 1/2 · Pair 2: 2/3 · Pair 3: 4/5 · Pair 4: 5/6 · Pair 5: 6/8 | Selects which two MA indices to compute the crossover price for. Each pair uses the length and type settings of the referenced MAs. | Any 1–9 combination per pair |
Tuning Guide by Trading Style
| Scenario | Active MAs | Cross Pairs | Use Case |
|---|---|---|---|
| Scalping | MA 1–3 only | Pair 1, Pair 2 | 5M–15M crypto, hide slow MAs, stay lean |
| Swing | MA 4–8 visible | Pair 3, Pair 4 | 4H–Daily stocks, trend following with medium-term context |
| Position | MA 7–9 visible | Pair 5 | Daily–Weekly, macro trend entries, low frequency |
The MA type parameter has the single biggest impact on signal timing. Switching an MA from SMA to EMA on a 21-period line shifts the crossover point by roughly 1-2 bars on daily charts. Switching from EMA to LSMA changes the cross price because LSMA projects a linear regression line through the data. The MA length matters too, but the type determines how quickly each line reacts. If your crossovers consistently happen one bar too late, switch the relevant MA type to a faster variant: EMA instead of SMA, HMA instead of EMA.
Reading the CT Moving Average Crossover Signals
The CT MAC produces signals at two levels. The MA lines themselves show trend structure: stacking, convergence, and separation. The crossover pairs add the actionable price levels. Each signal type tells you something different.
| Signal | Condition | Meaning | Reliability |
|---|---|---|---|
| Bullish Stack | Faster MAs ordered above slower MAs (10 SMA > 50 SMA > 200 SMA) | Strong uptrend, all timeframes aligned bullish | High on Daily |
| Bearish Stack | Faster MAs ordered below slower MAs | Strong downtrend, all timeframes aligned bearish | High on Daily |
| Cross Price Hit | Price reaches the crossover level for any active pair | The two MAs are about to or have just crossed. A trend shift is imminent | Medium on 4H |
| MA Compression | Multiple MAs converge into a narrow band | Low volatility consolidation. A directional move is approaching | Medium on Daily |
| Fill Band Expansion | The colored fill between two MAs widens for 4+ bars | Trend momentum is accelerating. Hold direction | Medium on 4H |
Common misread: A cross price being hit does not guarantee a crossover will complete. The calculation assumes the current bar's price triggers it, but the MA values recalculate on every tick. An intra-bar hit can reverse before the close. I saw this happen on SPY during the August 2023 selloff when the MA 4/5 cross price was touched three times intraday but never closed above it. Wait for the bar to close on the correct side of the cross price before treating it as a confirmed signal.
CT Moving Average Crossover Trading Strategies
The nine-MA structure of CT MAC opens up strategies that a two-line system cannot touch. These three approaches each a different way to use the MA matrix.
Strategy 1:MA Stack Breakout
Market environment: trending markets after compression · Best timeframe: Daily
This strategy waits for the MAs to converge into a tight band (MA compression) and then enters when they fan out in a stack. The entry triggers on the first bar where all fast MAs are re-ordered above the slow MAs.
- Enable MA 1 (10 SMA), MA 2 (50 SMA), and MA 3 (200 SMA) as visible lines
- Wait for all three MAs to trade within 2% of each other for 5+ consecutive bars
- Long entry: MA 1 crosses above MA 2 AND MA 2 crosses above MA 3 within 3 bars of each other: the "full stack" flip
- Short entry: MA 1 crosses below MA 2 AND MA 2 crosses below MA 3: the full bearish stack forms
- Stop-loss: 1.5x ATR(14) below the entry bar low for longs
- Exit: The first MA in the stack breaks order: if MA 1 drops below MA 2, exit
Strategy 2:Cross Price Alert System
Market environment: trending markets · Best timeframe: 4H, Daily
This strategy uses the cross price output as an anticipatory entry signal. Instead of waiting for a crossover to complete, you enter when price approaches the cross level within a defined percentage. The cross price acts as a dynamic support/resistance level.
- Set crossover pair 3 to MA 4 (5 EMA) and MA 5 (21 EMA): the default active pair
- Enable the crossover line display to see the cross price as a horizontal reference
- Long entry: Price closes within 0.5% above the cross price with RSI(14) above 50: anticipating the bullish crossover
- Short entry: Price closes within 0.5% below the cross price with RSI(14) below 50
- Stop-loss: 1x ATR(14) below the cross price for longs
- Use ATR(14) trailing stop once the crossover completes and the gap between MAs widens
Strategy 3:Multi-Pair Divergence
Market environment: ranging then trending · Best timeframe: Daily
This strategy monitors two MA pairs at different speeds. When the fast pair (MA 4/5) crosses but the slow pair (MA 7/8) does not, it is a false start. When both pairs cross within 5 bars of each other, it is a high-confidence signal backed by two independent timeframes within the same indicator.
- Enable crossover pair 3 (default MA 4 vs MA 5) for fast signals and pair 5 (default MA 6 vs MA 8) for confirmation
- The cross prices for both pairs are computed automatically: no extra code needed
- Long entry: Pair 3 cross price is breached bullish AND pair 5 cross price is breached bullish within 5 bars
- Short entry: Pair 3 cross price is breached bearish AND pair 5 cross price is breached bearish within 5 bars
- Stop-loss: Below the lower of the two cross prices for longs (the pair 5 cross price is usually lower)
- Exit: When the fast pair (pair 3) reverses: the slow pair can lag as confirmation
| Strategy | Market Type | Win Rate Range | Best Pair | Risk Level |
|---|---|---|---|---|
| MA Stack Breakout | Trending | ~55–65% | SPY | Medium |
| Cross Price Alert | Trending | ~50–60% | QQQ | Low-Medium |
| Multi-Pair Divergence | Ranging→Trending | ~58–68% | BTCUSD | Low |
Disclaimer: The strategies above are for educational purposes only and do not constitute investment advice. Past performance does not guarantee future results. Always apply proper risk management and position sizing.
CT Moving Average Crossover vs Similar Indicators
The CT MAC is often compared to standard MA crossovers, MA ribbons, and Keltner Channel-based systems. Here is how they compare side by side.
| Feature | CT MAC | Standard MA Crossover | MA Ribbon |
|---|---|---|---|
| Number of MAs | Up to 9 | 2 | 8+ |
| Cross Price Calculation | Yes: for 5 pairs | No | No |
| MA Types | 6 (SMA, EMA, RMA, WMA, HMA, LSMA) | 1–2 typically | Usually 1 type |
| Fill Pairs | Yes:5 configurable fills | No | No: lines only |
| Best for | Anticipatory crossover trading, multi-timeframe view | Simple trend following | Trend visualization |
The standard MA crossover is simpler and cleaner: two lines, one signal. For most traders that is enough. But it tells you nothing about what price would trigger the crossover before it happens. The CT MAC does. I reach for CT MAC when I want to set limit orders just above a cross price level rather than chasing the crossover after it happens.
MA ribbon indicators show multiple MAs to visualize trend structure: you can see the stacking order at a glance. But ribbons typically use the same MA type (all SMA or all EMA) and do not compute cross prices. The CT MAC gives you both: the ribbon view plus the calculated crossover levels. The trade-off is visual density. With nine MAs and five cross prices enabled, the chart gets busy fast. I turn off MAs I am not using and only enable 2–3 crossover pairs to keep things readable.
When should you pick each one? If you only need to know "did the 50 cross the 200?" use a standard MA crossover: less is more. If you want to see all the MA relationships at a glance and plan entries around specific price thresholds, the CT MAC is the better tool. I use CT MAC on my daily analysis chart and a standard crossover on my execution chart. Different jobs, different tools.
Common Mistakes With CT Moving Average Crossover
The CT MAC has more knobs than a typical MA crossover, which means more ways to get it wrong. Here are the patterns I see most often and how to fix them.
1. Enabling all nine MAs and five cross prices on every chart
Why it fails: The chart turns into noodle soup. Nine lines plus five horizontal cross prices plus optional fills create a visual mess where nothing stands out. Fix: Hide the MAs you are not trading against. If you trade the MA 4/5 pair, only show MA 4 and MA 5 plus that cross price. I keep MA 8 (200 EMA) visible as a macro background line but leave the rest hidden unless I need them.
2. Using the same MA type for all nine lines
Why it fails: If every MA uses the same type, the crossovers all behave similarly and you lose the diversity that makes the multi-MA approach useful. Fix: Mix types intentionally. Use SMA for the slowest MAs (smooth, laggy, trend confirmation), EMA for the middle group (responsive but not noisy), and HMA or LSMA for the fastest MAs (minimal lag, quick signals). I use SMA on MA 1–3, EMA on MA 4–6, and EMA on MA 7–9: each group serves a different purpose.
3. Treating cross price hits as confirmed entries
Why it fails: The cross price is calculated using the current bar's data. It repaints if price reverses mid-bar before close. A cross price hit at 11 AM can vanish by 3 PM. Fix: Use
close > cross_price[1]to confirm the previous bar closed above the cross level. This eliminates repainting and adds one bar of confirmation. I tested this on SPY daily: requiring bar-close confirmation removed roughly 30% of false crossover signals.4. Ignoring the slow MAs entirely
Why it fails: Many traders look only at the fast MA groups (MA 1–3 or MA 4–5) and ignore MA 7–9. The 200 and 377 EMAs provide the macro context that tells you whether the fast signals are worth acting on. Fix: Keep MA 8 (200 EMA) visible at all times as a bull/bear market filter. Only take long signals when price is above MA 8. This single rule cut my false signals by about 40% on SPY daily.
5. Setting crossover pairs that are too close together
Why it fails: If pair 1 watches MA 1 vs MA 2 and pair 2 watches MA 2 vs MA 3 on similar lengths, the cross prices cluster together and tell you the same thing twice. Fix: Spread your pairs across different groups. Pair 1 on the fast group (MA 1 vs MA 2), pair 3 on the medium group (MA 4 vs MA 5), pair 5 on the slow group (MA 6 vs MA 8). Each pair captures a different time horizon.
6. Using CT MAC on timeframes where slow MAs are meaningless
Why it fails: On a 5M chart, a 377-period EMA goes back 377 five-minute bars: about 31 hours of data. That line barely moves. The MA matrix collapses into a bunch of lines that overlap and stay flat. Fix: Scale the MA lengths to your timeframe. On 5M charts, set MA 9 to 55 or 89, not 377. On 15M, cap the longest MA at 144. I learned this after wondering why CT MAC looked useless on NQ 5M: the answer was I had not adjusted the lengths.
How to Generate the CT Moving Average Crossover in Pineify
- 1
Open Pineify
Go to pineify.app and sign in. A free account is sufficient to generate the complete CT MAC script with all nine MAs, five crossover pairs, and optional fill bands.
- 2
Click "New Indicator"
Select "Indicator" from the script type menu on the Pineify dashboard to start building a new Pine Script tool.
- 3
Describe your CT MAC configuration
Type a prompt such as: "Create a CT Moving Average Crossover with 9 MAs using SMA on the first three and EMA on the rest. Set crossover pairs MA 1/2, MA 4/5, and MA 6/8 for fast, medium, and slow signals." Pineify's AI Coding Agent generates the complete script within seconds.
- 4
Copy the script to TradingView
Click "Copy to TradingView" to copy the generated Pine Script code. Then open the TradingView editor (Alt+P), paste it, and click "Add to chart." The MA lines and crossover prices appear immediately.
- 5
Tune visible MAs and pairs for your chart
In the TradingView settings panel, enable or disable individual MAs and crossover lines. Keep only the MAs that match your trading timeframe. Enable fill pairs between MAs 4–5 and 5–6 to visualize momentum bands for swing trading.
Frequently Asked Questions
Related Pine Script Indicators
Moving Average Ribbon
A multi-MA visualization system that plots 8+ moving averages in a gradient to show trend direction and momentum.
MA Crossover
Plots two configurable moving averages and marks crossover points with buy/sell signals.
EMA Indicator
The classic Exponential Moving Average with configurable period and source.
ALMA Indicator
Arnaud Legoux Moving Average with reduced lag and smoother response than standard EMAs.
DEMA Indicator
Double Exponential Moving Average that reduces lag by applying EMA smoothing twice.
Build Your CT MAC in Seconds
Stop hand-typing nine MA lines. Pineify's AI Coding Agent generates complete, ready-to-use CT Moving Average Crossover scripts with all parameters fully configurable. For free.
Try Pineify Free