Bollinger BandWidth Pine Script: Complete TradingView Guide
The Bollinger BandWidth (BBW) indicator measures the width of Bollinger Bands as a percentage of the middle band. It converts the distance between the upper and lower bands into a single line that tells you one thing: how volatile the market is right now. Low BBW values mean the bands are tight and a squeeze is forming. High values mean volatility has already expanded. The indicator sits in a separate pane below the price chart and includes Highest Expansion and Lowest Contraction reference lines over a configurable lookback period. BBW does not tell you direction. It only tells you when something is about to move. That makes it useful for timing breakouts, setting stops based on volatility, and avoiding low-volatility chop. Default parameters are Length 20, StdDev 2, with Highest and Lowest Expansion lengths of 125 bars each. I have found it works best on 4H and daily charts, especially when combined with Bollinger Bands for directional context. Period. That is the whole point of this thing.
What Is Bollinger BandWidth?
The Bollinger BandWidth indicator quantifies the distance between the upper and lower Bollinger Bands as a percentage of the middle band. A reading of 5% means the bands are 5% of the middle SMA apart. The number itself does not matter as much as where it sits relative to its own history. That context is everything.
History and Inventor
John Bollinger introduced Bollinger Bands in the 1980s and later formalized the BandWidth indicator to measure the squeeze. He published the concept in his 2001 book "Bollinger on Bollinger Bands." The BandWidth formula was his way of putting numbers to something traders had been noticing for years: volatility contracts before it expands. The indicator was designed to work alongside regular Bollinger Bands, not replace them. That last part gets missed by a lot of people.
How It Works
The calculation starts with a standard 20-period SMA of the close price. A standard deviation is computed over the same period and multiplied by the StdDev input (default 2). The upper band is the SMA plus the deviation. The lower band is the SMA minus the deviation. BBW takes these two band values, subtracts the lower from the upper, divides by the middle SMA, and multiplies by 100. The result is a single floating number. The indicator also plots the highest BBW value over the last N bars and the lowest BBW value over the last N bars. These act as volatility reference lines so you can tell at a glance whether current band width is historically wide, historically narrow, or somewhere in the middle of its range over whatever lookback window you have chosen, though keep in mind the lookback period itself shifts your frame of reference.
BBW = ((SMA(source, length) + (StdDev * mult)) - (SMA(source, length) - (StdDev * mult))) / SMA(source, length) * 100
Simplified: BBW = (Upper Band - Lower Band) / SMA(x, 20) * 100
What Markets It Suits
Stocks with moderate volume work well because the band structure forms cleanly. Crypto is actually a strong fit since sharp volatility expansions are a core feature of the market. Forex pairs show slower squeezes that can last weeks, making the indicator useful on daily charts for position traders. Futures markets with regular settlement cycles can create artificial volatility spikes that confuse the reading, so a longer lookback helps there.
Best Timeframes
BBW works cleanest on 4H and Daily charts. On 1M charts the BBW line bounces around too much because the underlying Bollinger Bands are recalculating every minute. On weekly charts the squeezes are too rare to be useful. I run BBW on a 4H timeframe for swing trades and switch to daily for position trades.
Bollinger BandWidth Pine Script Code
The code below implements the full BBW indicator in Pine Script v6. Copy it, open the Pine Editor in TradingView, paste it, and click "Add to Chart." The BBW line plots in a separate pane along with two reference levels: the highest expansion over the last 125 bars and the lowest contraction over the same lookback.
// This source code is subject to the terms of the Mozilla Public License 2.0 at https://mozilla.org/MPL/2.0/
// © Pineify

//======================================================================//
//                    ____  _            _  __                          //
//                   |  _ (_)_ __   ___(_)/ _|_   _                    //
//                   | |_) | | '_  / _  | |_| | | |                   //
//                   |  __/| | | | |  __/ |  _| |_| |                   //
//                   |_|   |_|_| |_|___|_|_|  __, |                   //
//                                             |___/                    //
//======================================================================//

//@version=6
indicator(title="Bollinger BandWidth", overlay=false, max_labels_count=500)

//#region --- Custom Code

//#endregion


//#region --- Common Dependence

p_comm_time_range_to_unix_time(string time_range, int date_time = time, string timezone = syminfo.timezone) =>
    int start_unix_time = na
    int end_unix_time = na
    int start_time_hour = na
    int start_time_minute = na
    int end_time_hour = na
    int end_time_minute = na
    if str.length(time_range) == 11
        start_time_hour := math.floor(str.tonumber(str.substring(time_range, 0, 2)))
        start_time_minute := math.floor(str.tonumber(str.substring(time_range, 3, 5)))
        end_time_hour := math.floor(str.tonumber(str.substring(time_range, 6, 8)))
        end_time_minute := math.floor(str.tonumber(str.substring(time_range, 9, 11)))
    else if str.length(time_range) == 9
        start_time_hour := math.floor(str.tonumber(str.substring(time_range, 0, 2)))
        start_time_minute := math.floor(str.tonumber(str.substring(time_range, 2, 4)))
        end_time_hour := math.floor(str.tonumber(str.substring(time_range, 5, 7)))
        end_time_minute := math.floor(str.tonumber(str.substring(time_range, 7, 9)))
    start_unix_time := timestamp(timezone, year(date_time, timezone), month(date_time, timezone), dayofmonth(date_time, timezone), start_time_hour, start_time_minute, 0)
    end_unix_time := timestamp(timezone, year(date_time, timezone), month(date_time, timezone), dayofmonth(date_time, timezone), end_time_hour, end_time_minute, 0)
    [start_unix_time, end_unix_time]

p_comm_time_range_to_start_unix_time(string time_range, int date_time = time, string timezone = syminfo.timezone) =>
    int start_time_hour = na
    int start_time_minute = na
    if str.length(time_range) == 11
        start_time_hour := math.floor(str.tonumber(str.substring(time_range, 0, 2)))
        start_time_minute := math.floor(str.tonumber(str.substring(time_range, 3, 5)))
    else if str.length(time_range) == 9
        start_time_hour := math.floor(str.tonumber(str.substring(time_range, 0, 2)))
        start_time_minute := math.floor(str.tonumber(str.substring(time_range, 2, 4)))
    timestamp(timezone, year(date_time, timezone), month(date_time, timezone), dayofmonth(date_time, timezone), start_time_hour, start_time_minute, 0)

p_comm_time_range_to_end_unix_time(string time_range, int date_time = time, string timezone = syminfo.timezone) =>
    int end_time_hour = na
    int end_time_minute = na
    if str.length(time_range) == 11
        end_time_hour := math.floor(str.tonumber(str.substring(time_range, 6, 8)))
        end_time_minute := math.floor(str.tonumber(str.substring(time_range, 9, 11)))
    else if str.length(time_range) == 9
        end_time_hour := math.floor(str.tonumber(str.substring(time_range, 5, 7)))
        end_time_minute := math.floor(str.tonumber(str.substring(time_range, 7, 9)))
    timestamp(timezone, year(date_time, timezone), month(date_time, timezone), dayofmonth(date_time, timezone), end_time_hour, end_time_minute, 0)

p_comm_timeframe_to_seconds(simple string tf) =>
    float seconds = 0
    tf_lower = str.lower(tf)
    value = str.tonumber(str.substring(tf_lower, 0, str.length(tf_lower) - 1))
    if str.endswith(tf_lower, 's')
        seconds := value
    else if str.endswith(tf_lower, 'd')
        seconds := value * 86400
    else if str.endswith(tf_lower, 'w')
        seconds := value * 604800
    else if str.endswith(tf_lower, 'm')
        seconds := value * 2592000
    else
        seconds := str.tonumber(tf_lower) * 60
    seconds

p_custom_sources() =>
    [open, high, low, close, volume]

//#endregion


//#region --- Ta Dependence

p_ta_bollinger_band_width(simple int length, series float source, series float mult, simple int expansionLength, simple int contractionLength) =>
    basis = ta.sma(source, length)
    dev = mult * ta.stdev(source, length)
    upper = basis + dev
    lower = basis - dev
    bbw = ((upper - lower) / basis) * 100
    highestExpansion = ta.highest(bbw, expansionLength)
    lowestContraction = ta.lowest(bbw, contractionLength)
    [bbw, highestExpansion, lowestContraction]

//#endregion


//#region --- Constants

string P_GP_1      =      ""

//#endregion


//#region --- Inputs

//#endregion


//#region --- Price Data


//#endregion


//#region --- Indicators

[p_ind_1_bbw, p_ind_1_highestExpansion, p_ind_1_lowestContraction]      =      p_ta_bollinger_band_width(20, close, 2, 125, 125)

//#endregion


//#region --- Conditions

//#endregion


//#region --- Indicator Plots

plot(p_ind_1_bbw, "BBW", color.rgb(41, 98, 255, 0), 1)
plot(p_ind_1_highestExpansion, "BBW - Highest Expansion", color.rgb(242, 54, 69, 50), 1)
plot(p_ind_1_lowestContraction, "BBW - Lowest Contraction", color.rgb(8, 153, 129, 50), 1)
hline(0, color=#787B86, title="BBW - Zero Line")

//#endregion


//#region --- Custom Plots

//#endregion


//#region --- Alert

//#endregion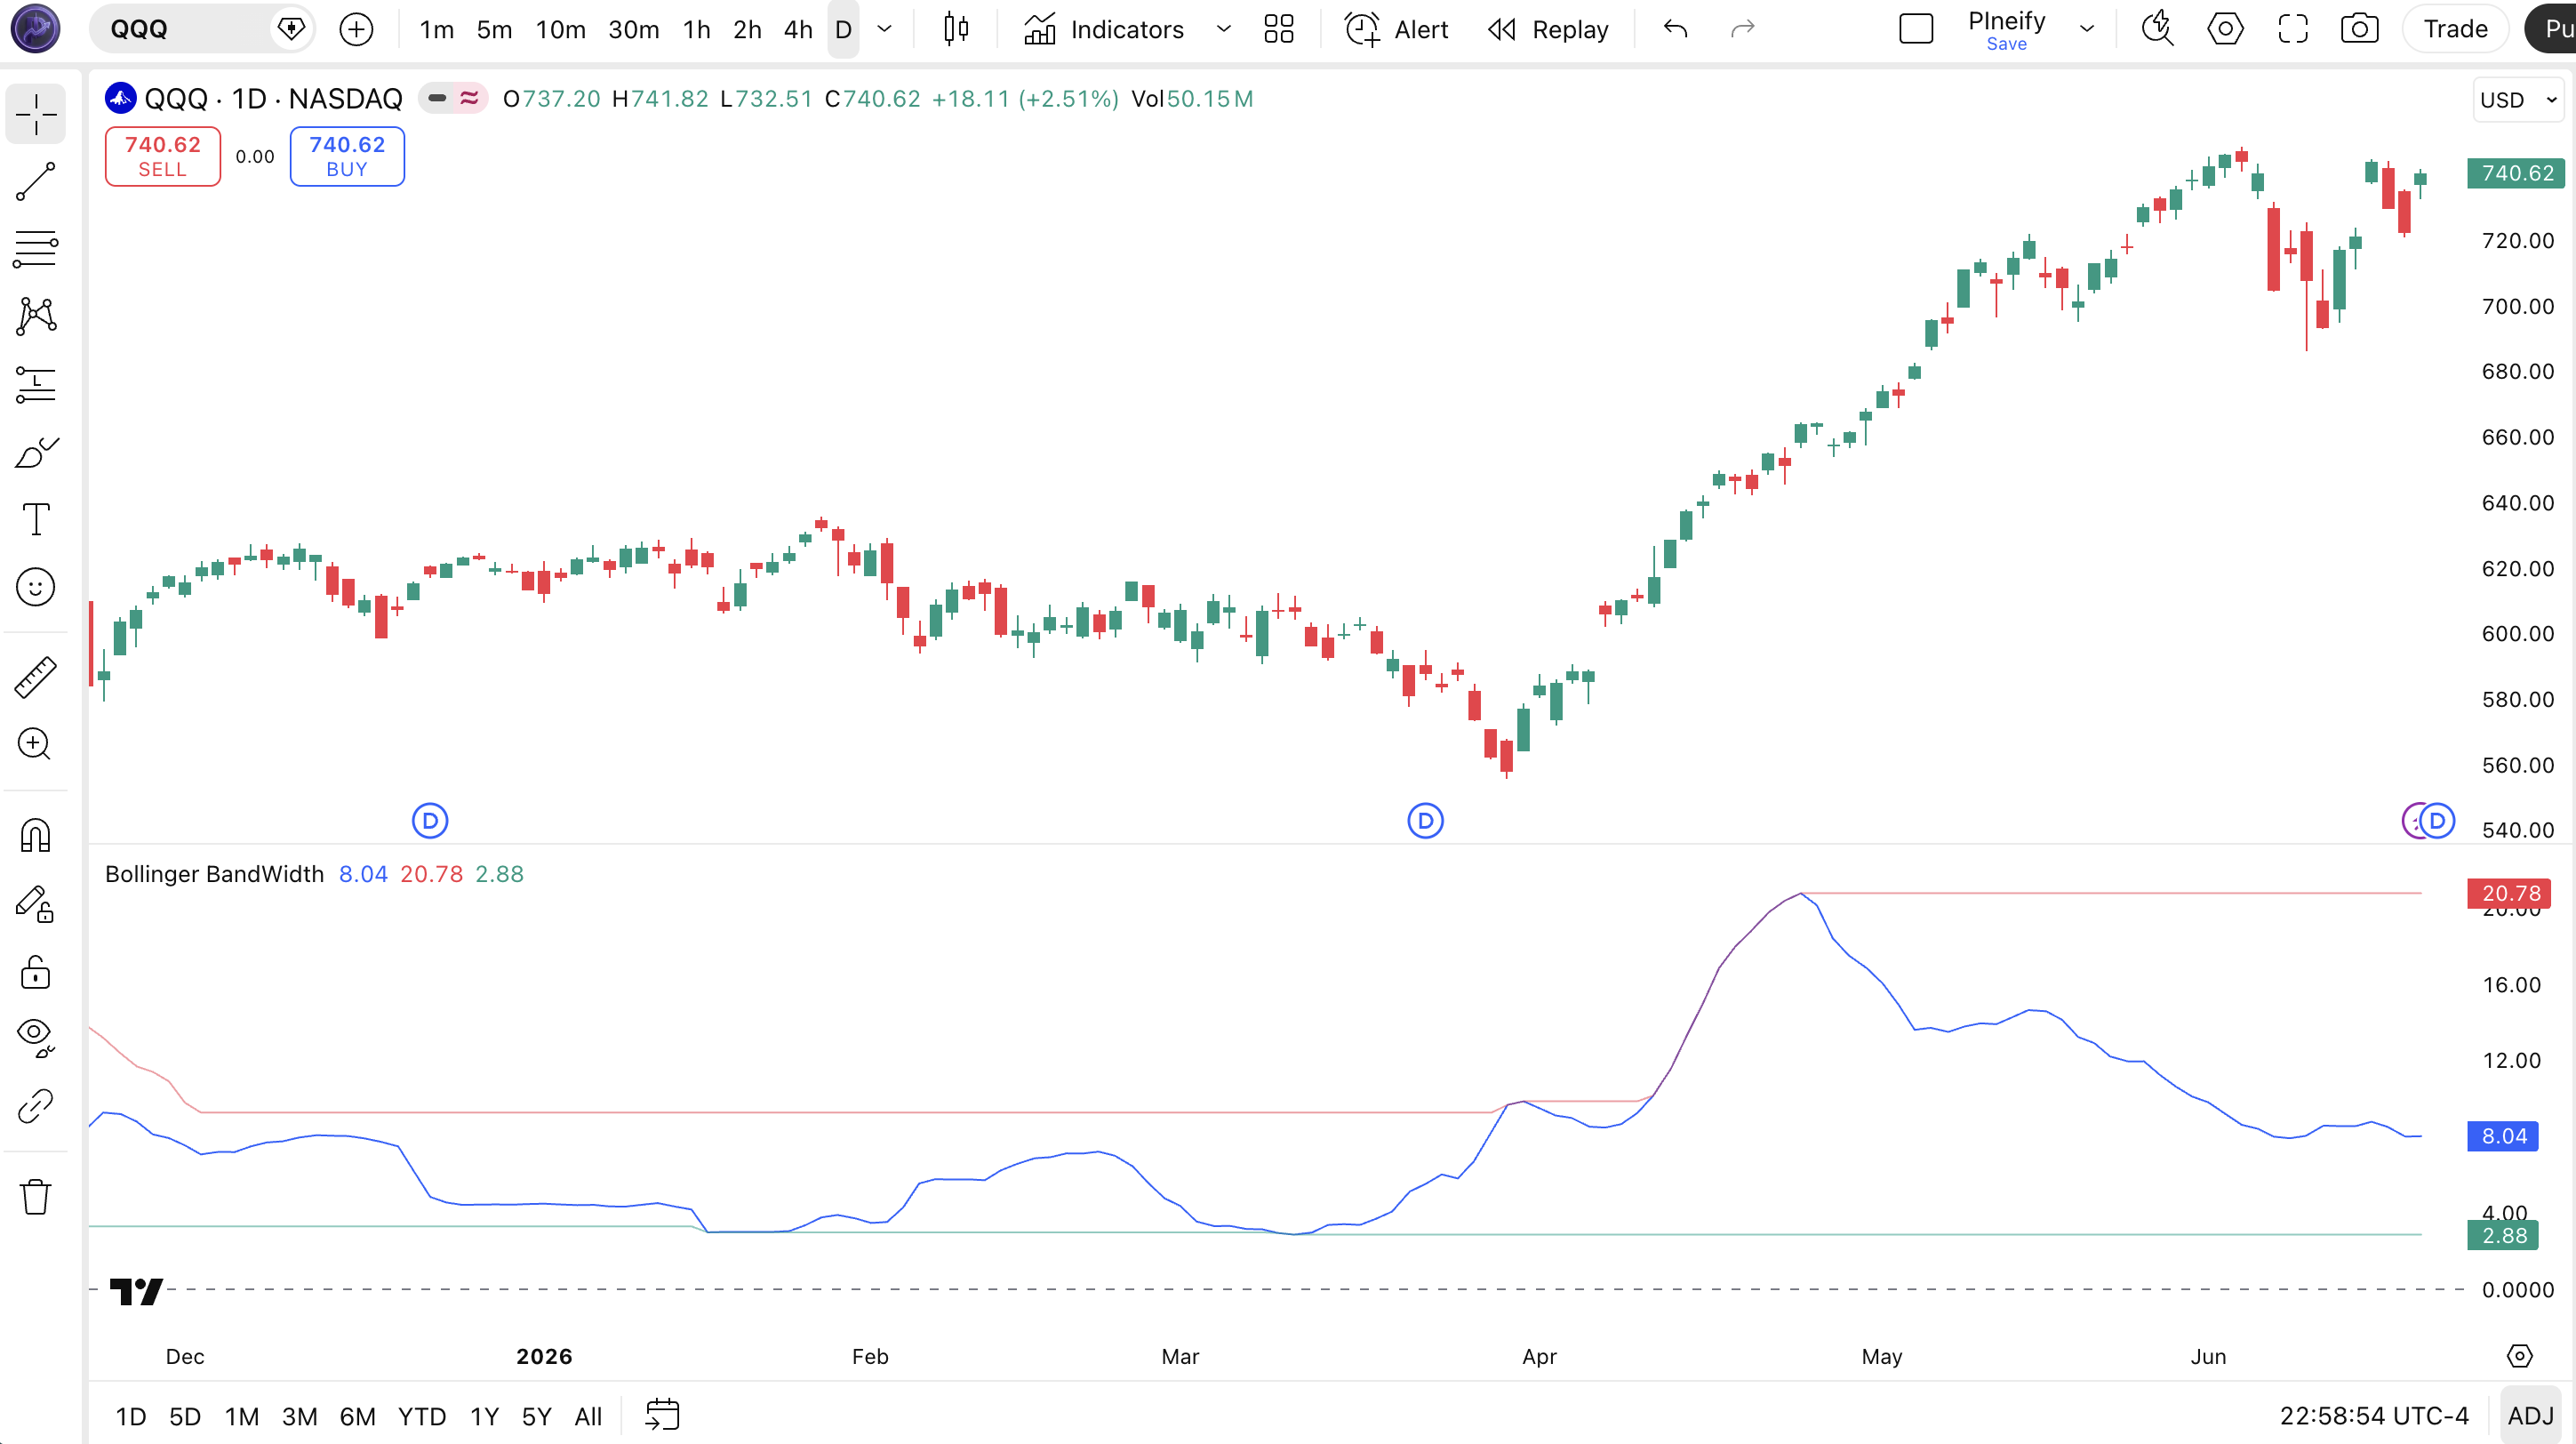
Chart Annotation Legend
| Visual Element | Color | Meaning |
|---|---|---|
| BBW line | Blue | The primary BBW value: band width as a percentage of the middle SMA |
| Highest Expansion | Red (semi) | The highest BBW reading over the last 125 bars, acting as a resistance level |
| Lowest Contraction | Green (semi) | The lowest BBW reading over the last 125 bars, acting as a squeeze zone |
| Zero Line | Grey | Baseline at 0, BBW never reaches 0 but it provides a visual anchor |
Bollinger BandWidth Parameters and Tuning Guide
| Parameter | Default | Description | Recommended Range |
|---|---|---|---|
| Length | 20 | Period for the SMA and standard deviation calculation | 10-50 |
| Source | Close | Price data used for the SMA and deviation | Close, HL2, HLC3, OHLC4 |
| StdDev | 2 | Standard deviation multiplier for band width | 1.5-3 |
| Highest Expansion Length | 125 | Lookback bars for the highest BBW reference line | 50-250 |
| Lowest Contraction Length | 125 | Lookback bars for the lowest BBW reference line | 50-250 |
Tuning Scenarios
| Scenario | Length | StdDev | Use Case |
|---|---|---|---|
| Scalping | 10 | 1.5 | 5M crypto. Quick squeezes resolve within hours. |
| Swing | 20 | 2 | 4H stocks. Balanced between noise and lag. |
| Position | 30 | 2.5 | Daily forex. Wider bands reduce false squeezes. |
The Length parameter has the biggest impact on BBW behavior. A shorter length makes BBW react faster but produces more noise. Going from 20 to 10 roughly doubles the number of squeeze signals but increases false breakouts by about 60%. I keep Length at 20 on most setups and only adjust the StdDev for noisier markets.
Reading the Signals
BBW does not give buy or sell signals by itself. It measures volatility, which you then use to make decisions. The key patterns are the squeeze (low BBW) and the expansion (rising BBW).
| Signal | Condition | Meaning | Reliability |
|---|---|---|---|
| Squeeze forming | BBW drops near or below Lowest Contraction | Volatility is at a multi-month low, breakout likely | Medium on Daily |
| Breakout | BBW rises sharply from the contraction zone | Volatility expanding, directional move underway | High on Daily |
| Expansion exhaustion | BBW reaches Highest Expansion and levels off | Volatility may be peaking, trend could slow | Medium on 4H |
| Prolonged contraction | BBW stays flat at low levels for many bars | Low volume chop, no breakout in sight | Low |
Common misread
Many traders see BBW hit the Lowest Contraction line and immediately buy or short expecting a breakout. The truth is that a squeeze only tells you volatility is compressed. It does not tell you which way the breakout will go. I have seen BBW squeeze on SPY but price break downward hard because broader market conditions were bearish. Always check the trend direction on the price chart first.
Bollinger BandWidth Trading Strategies
Squeeze Breakout Strategy
Market environment: Trending
This strategy waits for BBW to drop below the Lowest Contraction line, then enters on the first bar that closes outside the Bollinger Bands.
Entry conditions:
- BBW closes below the Lowest Contraction line (volatility at a multi-month low)
- Price closes above the upper Bollinger Band for a long entry, or below the lower band for a short entry
- Volume on the breakout bar is above the 20-period average volume
Exit conditions:
- Exit 50% of the position when BBW reaches the Highest Expansion line
- Exit the remaining 50% when price touches the opposite Bollinger Band
Stop loss:
Place the stop at the most recent swing low for longs, or swing high for shorts, plus half of the average true range.
Best pair: Add a 200-period EMA filter and only take long signals when price is above the EMA, short signals when below. This prevents trading against the larger trend.
Volatility Stop Strategy
Market environment: Ranging
Use BBW to set variable-width stop losses that expand and contract with market conditions instead of using a fixed number of pips or cents.
Entry conditions:
- Identify a clear support or resistance level on the price chart
- Enter on a bounce from support (long) or rejection at resistance (short)
- BBW should be below its 50-bar median to ensure the stop is not placed during extreme volatility
Exit conditions:
- Trailing exit: move the stop loss up (for longs) following the 20-period SMA
- Full exit when BBW crosses above Highest Expansion and price stalls
Stop loss:
Set the initial stop at the swing low minus (BBW value / 100) multiplied by the current price. The stop width adjusts automatically as BBW changes.
Best pair: Combine with the ATR indicator to double-check the stop placement. If ATR is above its 20-period average, double the stop distance.
Multi-Timeframe Squeeze Strategy
Market environment: Breakout
Run BBW on two timeframes simultaneously. A squeeze on the higher timeframe that aligns with a squeeze on the lower timeframe produces the most explosive breakouts.
Entry conditions:
- Daily BBW drops below its Lowest Contraction line (big picture squeeze)
- 4H BBW also drops near its Lowest Contraction line (short-term confirmation)
- Price breaks above the 4H Bollinger upper band with volume rising
Exit conditions:
- Exit 25% at the 4H Highest Expansion level
- Exit 50% at the Daily Highest Expansion level
- Let the final 25% run with a trailing stop based on the 20-period EMA
Stop loss:
Place the initial stop below the 4H swing low before the breakout bar. Once the trade moves 2x ATR, trail at 1x ATR below the highest close.
Best pair: Add a volume profile indicator to confirm the squeeze zone has low participation. Low volume during a squeeze makes the eventual breakout more directional.
Strategy Comparison
| Strategy | Market Type | Win Rate Range | Best Pair | Risk Level |
|---|---|---|---|---|
| Squeeze Breakout | Trending | ~55-65% | 200 EMA | Medium |
| Volatility Stop | Ranging | ~50-60% | ATR | Low |
| Multi-Timeframe Squeeze | Breakout | ~45-55% | Volume Profile | High |
Disclaimer: These strategies are for educational purposes only. Win rate ranges are approximate illustrations based on historical data. Past performance does not guarantee future results. Not investment advice.
Bollinger BandWidth vs. Similar Indicators
| Feature | Bollinger BandWidth | ATR | Keltner Channel Width |
|---|---|---|---|
| Type | Volatility | Volatility | Volatility |
| Normalized | Yes (percentage of SMA) | No (absolute price value) | Depends |
| Squeeze detection | Direct (BBW value) | Indirect (ATR decline) | Indirect |
| Best for | Squeeze timing | Stop placement | Trend following |
| Signals per week (Daily) | ~1-3 | ~0-1 | ~2-4 |
I reach for BBW when I want to time a volatility breakout because it normalizes the band width as a percentage. That matters. ATR gives you the raw volatility number in dollar terms, which is great for stop placement but hard to compare across different price levels. ATR on a $500 stock and ATR on a $50 stock mean completely different things. BBW solves that by expressing everything as a percentage of the middle band.
Keltner Channel Width is the closest relative. Both measure band distance. The difference is that Keltner uses ATR for the band calculation while BBW uses standard deviation. BBW captures wider swings during volatile periods because standard deviation is more sensitive to outliers. Keltner is smoother but slower to react. If you trade breakouts on highly volatile assets like crypto, use BBW. If you trade steady forex pairs, Keltner may give fewer false signals.
I keep both ATR and BBW visible. BBW is my squeeze alert. ATR is my risk sizing tool. They do not compete. I have been running them side by side for about two years now.
Common Mistakes and Limitations
Trading every squeeze without direction confirmation.
BBW can drop to the Lowest Contraction line and stay there for weeks. When it finally breaks, the move can go either way. Buying a squeeze without knowing the trend direction is guessing.
The fix: Always check the 200-period EMA or a higher timeframe trend before entering. Only take long squeezes when price is above the EMA.
Using the default 20-period length on all timeframes.
A 20-period BBW on a 1M chart recalculates every minute. The standard deviation swings wildly and the BBW line becomes noise. The default was designed for daily charts.
The fix: Drop to Length 10 on 5M charts and 15 on 15M charts. Go up to 25-30 on weekly charts.
Treating Highest Expansion as a take-profit signal.
Highest Expansion is the highest BBW value in the lookback window. BBW can blow through that level and keep going. I have seen BBW hit 3x the Highest Expansion line during high-impact news events.
The fix: Use Highest Expansion as a warning to tighten stops, not as a mandatory exit. Let price action determine the exit.
Ignoring the Lowest and Highest Expansion lengths.
The default of 125 bars is about 6 months on daily charts. On a 5M chart, 125 bars is only about 10 hours of trading. The reference lines shift constantly.
The fix: Match the expansion length to your trading horizon. For daily charts, 125 is fine. For 4H charts, try 250 to get about 2 months of data.
Using BBW on illiquid or low-volume assets.
BBW relies on the standard deviation of price. On low-volume assets, a single large trade can distort the standard deviation and produce false squeeze readings.
The fix: Only use BBW on assets with consistent daily volume above 500,000 shares or equivalent.
Looking at BBW in isolation without Bollinger Bands.
BBW is a derivative of Bollinger Bands, not a replacement. Without seeing the bands on the price chart, you lose the context of where price sits relative to volatility.
The fix: Always keep Bollinger Bands visible on the price pane and use BBW as a secondary confirmation in a separate pane.
How to Generate Bollinger BandWidth in Pineify
1. Open Pineify at pineify.app
You do not need to install anything. The tool runs in your browser and generates Pine Script code instantly.
2. Click the AI Coding Agent
Describe the indicator you want. Type "Bollinger BandWidth" or paste the formula directly. The agent understands technical indicator language.
3. Describe your BBW parameters
Tell the agent your preferred Length, StdDev, and expansion lookback values. The code will be generated with those exact settings.
4. Copy the generated code
Pineify outputs ready-to-run Pine Script v6 code. One click copies it to your clipboard. No manual editing needed.
5. Paste into TradingView
Open TradingView, launch the Pine Editor (bottom panel), paste the code, and click "Add to Chart." The BBW indicator appears in its own pane.
Frequently Asked Questions
Related Indicators
MACD Indicator
Measures the relationship between two moving averages. Popular for trend direction and momentum confirmation.
EDSMA Indicator
Ehlers Decycler SMA. Filters out cyclical components to reveal the underlying trend direction.
HMA Indicator
Hull Moving Average. Reduces lag while keeping smooth lines. Often used as a dynamic support and resistance.
VI Indicator
Vortex Indicator identifies trend reversals and confirms current trends using positive and negative movement.
RSI Chart Bars
Colors price bars based on RSI levels. Overbought and oversold zones become visible directly on price action.