Average True Range Percentage Pine Script: Complete TradingView Guide
The ATRP does one thing regular ATR cannot: it lets you compare volatility across any two securities, regardless of price. ATRP takes the standard ATR value and divides it by the closing price, turning absolute volatility into a percentage. A $200 stock with a $4 ATR gives 2% ATRP. A $20 crypto with the same $4 ATR gives 20% ATRP. Now you can see which instrument is actually more volatile relative to its price. This Pine Script implementation runs in a separate pane, plots the percentage line, and includes an optional smoothing MA so you can track volatility trends over time. Paste the code into TradingView's Pine Editor, adjust the timeframe and lookback, and start comparing volatility across asset classes within seconds.
What Is the Average True Range Percentage Indicator?
The ATRP is a volatility indicator that converts the Average True Range into a percentage of the closing price, making volatility comparable across securities at different price levels. Regular ATR gives an absolute number that depends entirely on price. A share of Berkshire Hathaway and a share of a $5 penny stock would show ATR values in completely different ranges. ATRP removes that price dependency.
History and Inventor
ATRP inherits its core logic from the Average True Range, developed by J. Welles Wilder Jr. in his 1978 book New Concepts in Technical Trading Systems. The percentage formulation came later as traders realised that ATR values scaled with price made cross-asset comparison difficult. The ATRP conversion is a simple modification: divide by close, multiply by 100. The genius is in how that one arithmetic step changes what you can see.
How It Works
First, the True Range is calculated as the greatest of three values: current high minus current low, absolute high minus previous close, or absolute low minus previous close. ATR is then the exponential moving average of True Range over the lookback period (default 14). ATRP divides that ATR value by the closing price and multiplies by 100 to express it as a percentage.
Formula: ATRP = (ATR / Close) x 100
Where ATR = EMA(TR, lookback)
And TR = max(high - low, |high - previous close|, |low - previous close|)
What Markets It Suits
- Stocks - Excellent for comparing volatility across a watchlist of stocks at different price levels.
- Crypto - Ideal. Crypto markets have extreme price disparity. ATRP normalises it.
- Forex - Works well. Major pairs tend to show tight ATRP ranges (0.2-0.5%) while exotics are wider.
- Futures - Good but less necessary since futures contracts have standardised pricing.
Best Timeframes
ATRP works cleanest on daily and weekly charts. The percentage output smooths naturally on higher timeframes. On 1H and below, the division by close amplifies intraday noise and the indicator becomes choppy. For sub-daily use, shorten the lookback to 7 and expect more whipsaw in the MA crossovers.
ATRP Pine Script Code: Full Implementation
Below is the complete Pine Script v6 code for the ATRP indicator. It calls ta.atr() on the configured timeframe, divides by the current close, and multiplies by 100. An optional smoothing MA, configurable in type and length, is layered on top. Copy the code, open TradingView's Pine Editor, paste it in, and hit "Add to Chart."
The indicator runs in a separate pane. It does not overlay on price. The white line is the raw ATRP value; the green line is the smoothing moving average.
// This source code is subject to the terms of the Mozilla Public License 2.0 at https://mozilla.org/MPL/2.0/
// © Pineify

//@version=6
indicator(title="Average True Range Percentage", overlay=false, max_labels_count=500)

p_ta_ma(series float source, simple int length, simple string ma_type) =>
    switch ma_type
        "SMA" => ta.sma(source, length)
        "EMA" => ta.ema(source, length)
        "RMA" => ta.rma(source, length)
        "HMA" => ta.hma(source, length)
        "WMA" => ta.wma(source, length)
        "TMA" => ta.sma(ta.sma(source, math.ceil(length / 2)), math.floor(length / 2) + 1)

p_ta_atrp(simple string atrTimeframe, simple int atrLookback, simple bool useMA, simple string maType, simple int maLength) =>
    atrValue = request.security(syminfo.tickerid, atrTimeframe, ta.atr(atrLookback))
    atrp = (atrValue / close) * 100
    atrpMA = useMA ? request.security(syminfo.tickerid, atrTimeframe, p_ta_ma(atrp, maLength, maType)) : na
    [atrp, atrpMA]

[p_ind_1_atrp, p_ind_1_atrpMA] = p_ta_atrp("1D", 14, true, "SMA", 20)

plot(p_ind_1_atrp, title="ATRP", color=color.new(color.white, 0), linewidth=2)
plot(p_ind_1_atrpMA, title="ATRP MA", color=color.new(#4CAF50, 0), linewidth=3)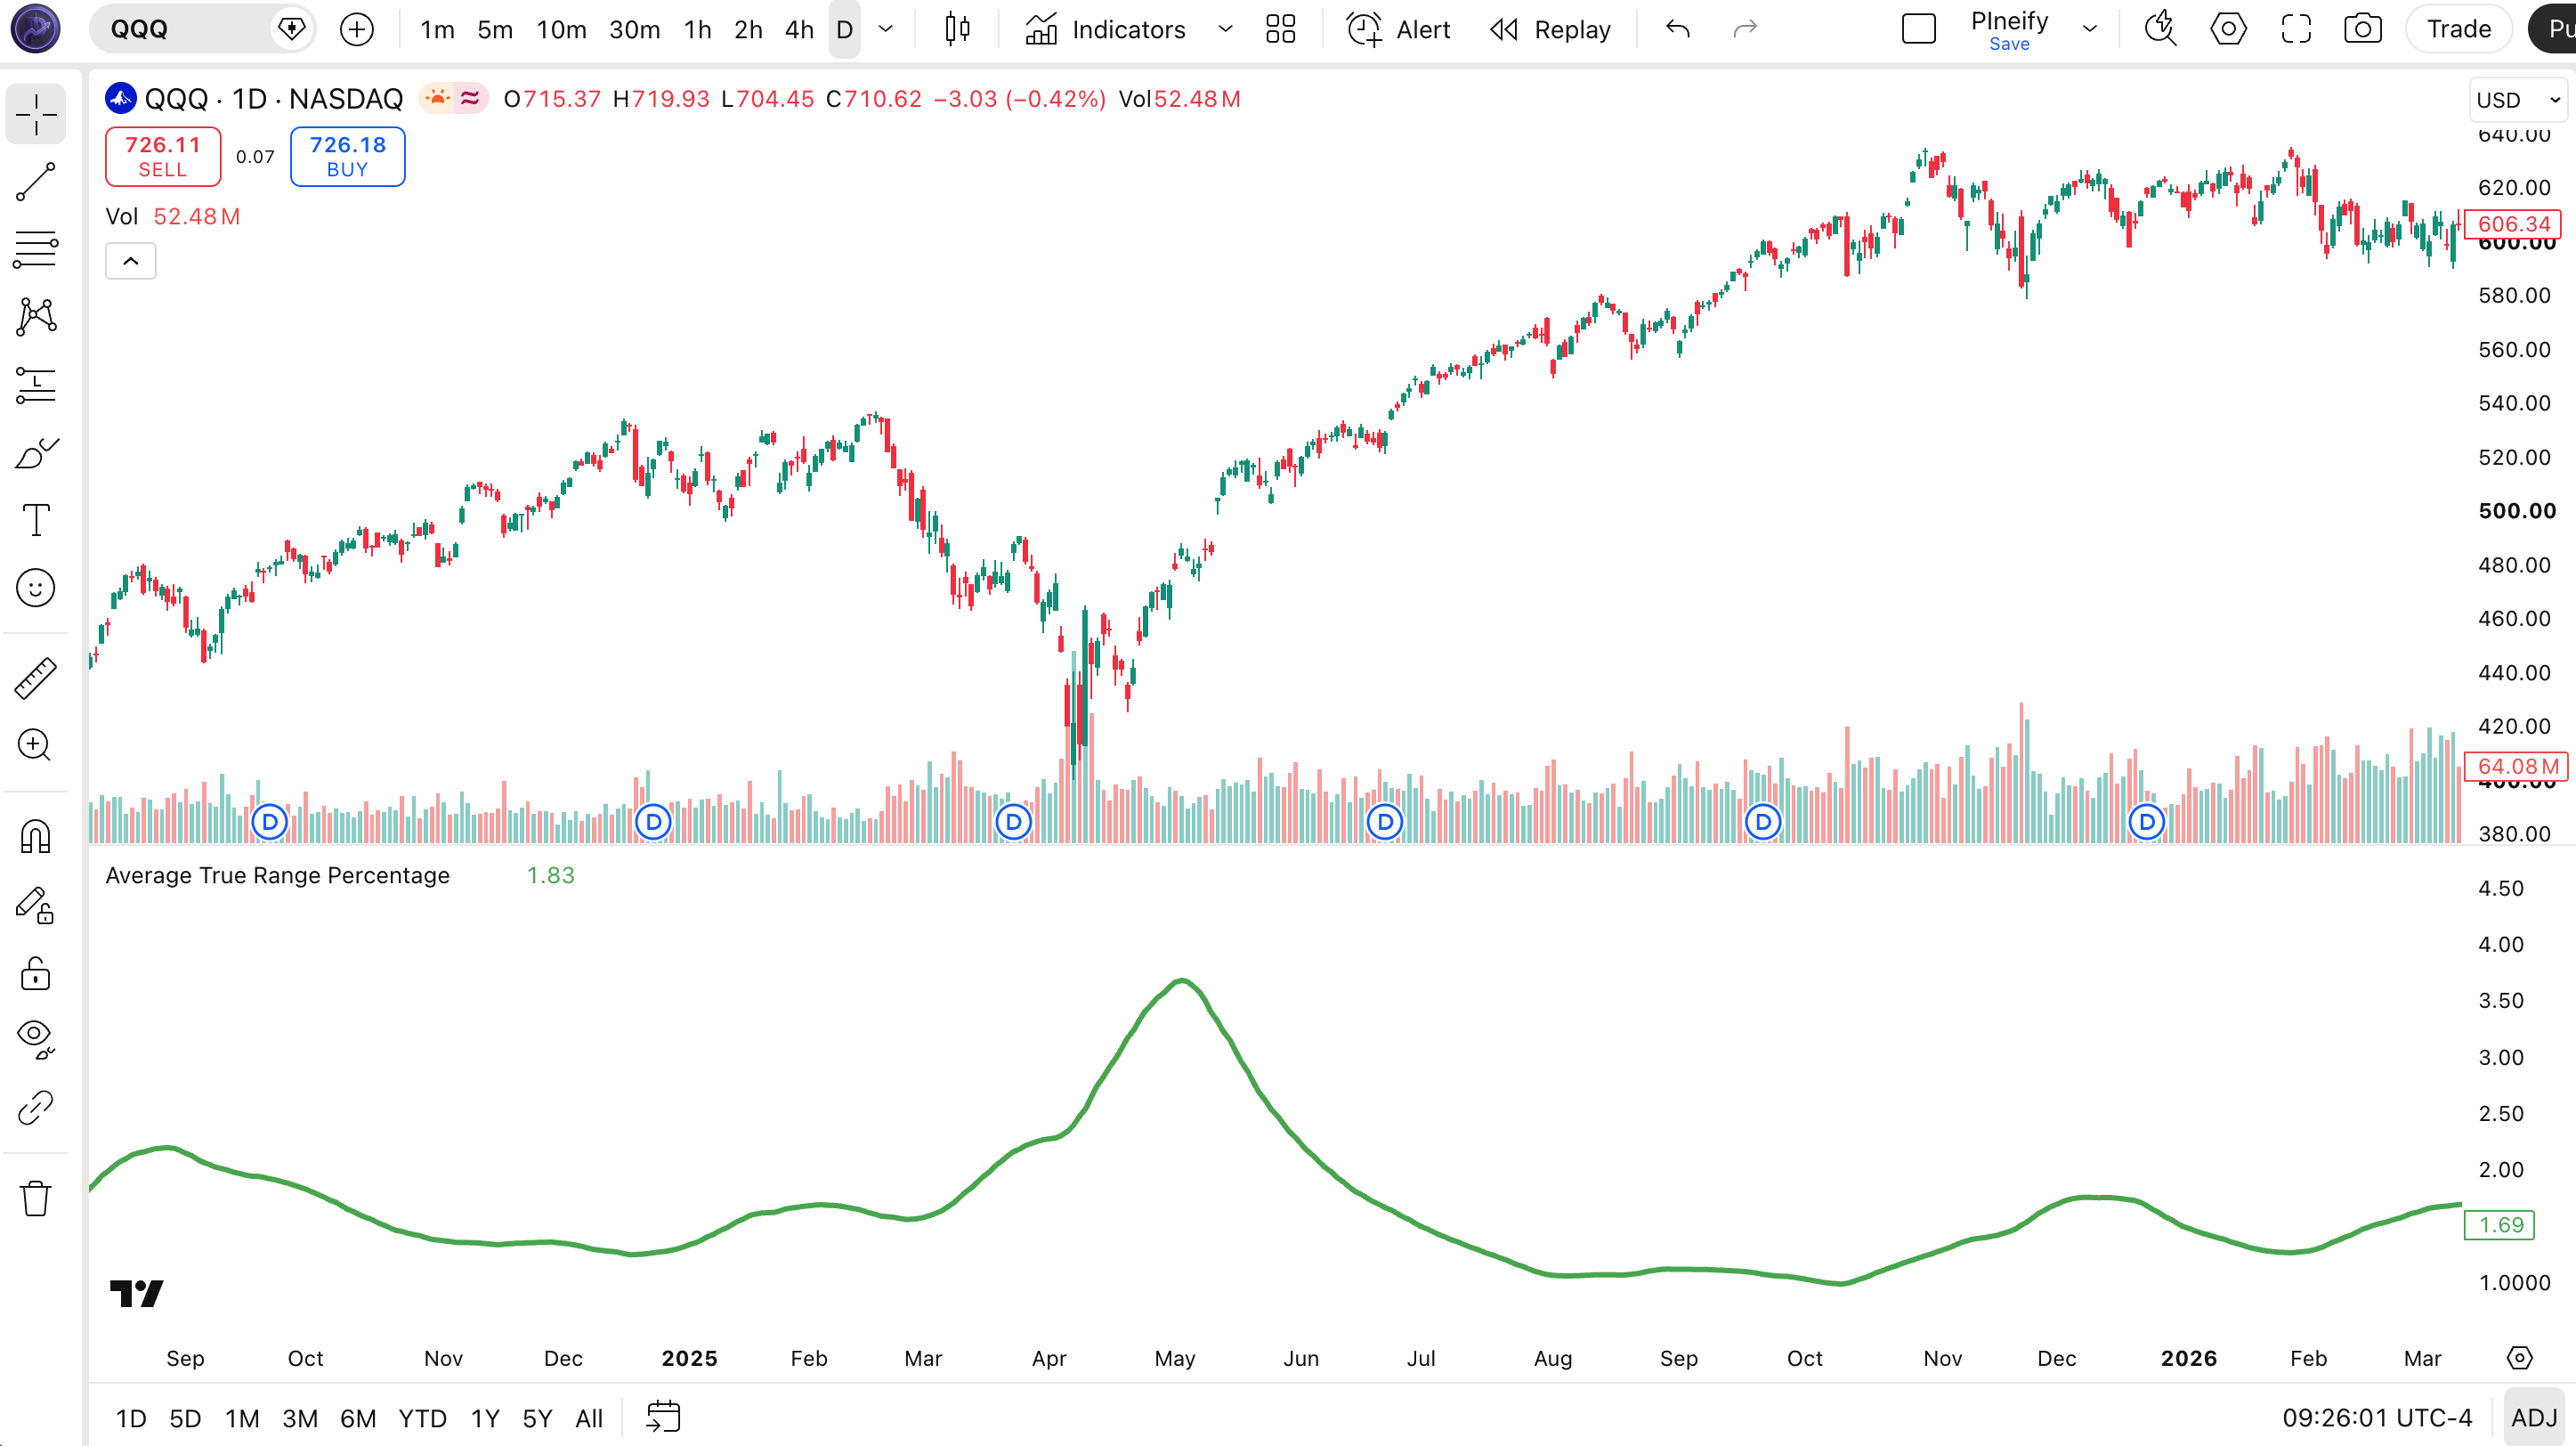
Chart Annotation Legend
| Element | Description |
|---|---|
| White Line (ATRP) | The raw ATRP value per bar, expressed as a percentage of closing price. |
| Green Line (ATRP MA) | Smoothing moving average of the ATRP line (SMA 20 by default). |
| Rising White Line | Volatility is expanding relative to price. Candle ranges are growing. |
| Falling White Line | Volatility is contracting. The market is compressing before a potential breakout. |
ATRP Parameters and Configuration Guide
Five parameters control how ATRP behaves. The ATR Timeframe and Lookback Period determine the core volatility calculation. The MA settings add a trend-smoothing layer for spotting volatility regime shifts.
| Parameter | Default | Description | Recommended Range |
|---|---|---|---|
| ATR Timeframe | 1D | Timeframe used to calculate the ATR value before converting to a percentage. | 1D to 1W |
| ATR Lookback Period | 14 | Number of bars used in the ATR calculation. Higher values smooth the line. | 7 - 21 |
| Show Moving Average? | true | Toggles a secondary moving average line on the ATRP output for trend smoothing. | true / false |
| MA Type | SMA | Type of moving average for the secondary line (SMA, EMA, RMA, HMA, WMA, TMA). | SMA or EMA |
| MA Length | 20 | Length of the smoothing moving average applied to the ATRP line. | 10 - 50 |
Tuning Scenarios
Different trading styles call for different ATRP configurations. Here is how I set it up for three common approaches.
| Scenario | Lookback | ATR TF | MA Length | Use Case |
|---|---|---|---|---|
| Scalping | 7 | 15M-1H | 10 | 5M-15M crypto or forex pairs |
| Swing | 14 | 1D | 20 | 4H-Daily stock or crypto |
| Position | 21 | 1W | 30 | Daily-weekly large-cap stocks |
The ATR Lookback Period has the biggest impact. Dropping it from 14 to 7 roughly doubles the number of ATRP spikes you see, but about 60% of those are noise on intraday charts. Keep it at 14 for daily, tighten to 10 for 4H, loosen to 21 for weekly.
How to Read ATRP Signals
ATRP does not give buy or sell signals. It tells you about the volatility environment. The interpretation comes from watching how the percentage changes relative to its own history and the smoothing MA.
| Signal | Condition | Meaning | Reliability (Daily) |
|---|---|---|---|
| Rising ATRP | ATRP line moves upward over several bars | Market volatility is expanding. Larger price swings expected. | High on Daily |
| Falling ATRP | ATRP line trends lower over multiple periods | Volatility is contracting. Price range is narrowing. | High on Daily |
| ATRP MA Crossover (Bullish) | ATRP crosses above its smoothing MA from below | Volatility is shifting from low to high. A breakout may be forming. | Medium on 1H |
| ATRP MA Crossover (Bearish) | ATRP crosses below its smoothing MA from above | Volatility is fading. Trending conditions may be ending. | Medium on 1H |
| ATRP Spike | Single-bar ATRP jump of 50%+ above the recent average | Extreme volatility event. Often a news-driven spike or a major breakout. | High (event driven) |
Common misread
A rising ATRP does not mean a breakout is coming. It means volatility is expanding. That expansion can happen during a steady uptrend, a crash, or sideways chop. I once saw a trader enter a long position on AAPL because ATRP was spiking, thinking it confirmed a breakout. Price promptly reversed. The spike just confirmed wide candles, not direction.
ATRP Trading Strategies
ATRP is not a standalone entry signal. Use it to size positions, place stops, and filter out low-volatility environments where most systems underperform.
Volatility Regime Filter
Best for: Trending markets
Use ATRP as a gatekeeper. Only take trades from your primary system when ATRP is above its 20-period SMA. This keeps you out of low-volatility chop zones where most systems get whipsawed.
Entry conditions:
- Primary system triggers a buy or sell signal (e.g., EMA crossover).
- ATRP line sits above its 20-period smoothing MA.
- ATRP value is in the middle third of its 50-bar range, not at extremes.
Exit conditions:
- ATRP drops below the smoothing MA, signalling volatility contraction.
- Alternatively, trail stop at 2x current ATRP value.
Stop-loss: Place at 1.5x the current bar's ATR value (not ATRP, use raw ATR for stops in dollar/pip terms).
Improve it: Combine with ADX above 25. Strong trend + expanding volatility is a high-probability combo.
ATRP Divergence Setup
Best for: Ranging markets
When price makes higher highs but ATRP makes lower highs (bearish divergence on volatility), it suggests the move is running out of steam. The opposite (price making lower lows and ATRP making higher lows) signals potential reversal.
Entry conditions:
- Price prints a new swing high above the previous swing high.
- ATRP prints a lower high compared to the previous swing high.
- Enter short on the third bar after divergence is confirmed.
Exit conditions:
- ATRP crosses back above its smoothing MA.
- Or exit after price moves 2x the average ATRP-bar range from entry.
Stop-loss: Above the divergence swing high (for shorts). Below the swing low (for longs).
Improve it: Add RSI divergence as confirmation. Two divergence types on the same chart increase conviction.
ATRP Volatility Breakout
Best for: Breakout markets
After a prolonged period of low ATRP (compression), a sudden spike above the MA signals a volatility expansion that often accompanies a directional breakout.
Entry conditions:
- ATRP has been below its smoothing MA for at least 7 bars.
- ATRP closes above the MA with a single-bar spike of at least 30%.
- Price simultaneously breaks a key level (20-bar high or low).
Exit conditions:
- Trailing stop at 1.5x ATR (the raw value, not percentage).
- Or exit when ATRP crosses back below MA, signalling expansion is done.
Stop-loss: Below the breakout bar's low (for longs). Above the high (for shorts).
Improve it: Use Bollinger Bands squeeze alongside. When BB width contracts and ATRP compresses together, the follow-through on the breakout is usually stronger.
| Strategy | Market Type | Win Rate Range | Best Pair | Risk Level |
|---|---|---|---|---|
| Volatility Regime Filter | Trending | ~55-65% | ADX | Medium |
| ATRP Divergence | Ranging | ~50-60% | RSI | Low |
| Volatility Breakout | Breakout | ~45-55% | Bollinger Bands | High |
Disclaimer: For educational purposes only. Not investment advice. Past performance does not guarantee future results. Always test strategies on historical data before using real capital.
ATRP vs. ATR vs. ATR Band: Key Differences
These three volatility indicators share the same ATR ancestry but answer different questions. ATRP normalises by price. ATR gives raw distance. ATR Band draws support-resistance around price.
| Feature | ATRP | ATR | ATR Band |
|---|---|---|---|
| Unit | Percentage of price | Absolute (USD, pips, points) | Price channels |
| Cross-asset comparison | Yes | No | No |
| Pane | Separate | Separate | Overlay on price |
| Best for | Comparing volatility | Stop placement, position sizing | Visual S/R levels |
| Signals per day (Daily) | Continuous value | Continuous value | ~2-4 touches |
I reach for ATRP when I am building a cross-asset watchlist and want to see which instruments are heating up in relative terms. ATR stays on my chart for stop placement (I still need the raw dollar number for that). I use ATR Band when I want visual price levels that adapt to volatility without drawing them myself. If you are only trading one instrument at a known price, ATR is fine. If you scan across stocks, crypto, and forex in the same session, ATRP saves you from doing mental math every time you switch charts.
Common ATRP Mistakes and Limitations
ATRP is simple, but simple does not mean easy to use correctly. Here are the mistakes I have made (and watched others make) with this indicator.
Treating ATRP spikes as directional signals. A rising ATRP means volatility is expanding. It does not mean price is going up. In fact, some of the biggest ATRP spikes happen during flash crashes where price drops 5% in minutes. The fix: always confirm direction with a separate trend filter before acting on a volatility expansion.
Using the default 14 lookback on every timeframe. Wilder designed the 14-period ATR for daily charts. On a 5M chart, 14 bars covers barely an hour of trading. The ATRP will jump around from noise, not signal. Drop to 7 for 15M, keep 14 for daily, push to 21 for weekly.
Reading ATRP values in isolation. An ATRP of 1.5% means very different things on SPY vs. a small-cap biotech stock. SPY's ATRP typically sits around 0.8-1.2%. A 1.5% reading for SPY is high. For a penny stock, 1.5% is quiet. You need the context of the instrument's own ATRP history, not a universal threshold.
Ignoring the MA crossover entirely. The smoothing MA is the most useful part of the ATRP setup for many traders. Without it, the raw line jumps bar to bar and you have no baseline for what "high" or "low" means. The white line crossing the green line is a cleaner trigger than staring at the raw number.
Using ATRP for stop placement instead of ATR. A common mix-up. Stop-loss distance should be based on the raw ATR value (in dollars or pips), not the percentage. A 2% stop on a $200 stock is $4. A 2% stop on a $20 stock is $0.40. Your broker and risk model need absolute numbers, not percentages.
Overfitting the MA length. I have seen traders tweak the MA length from 19 to 21 to 22 to avoid a single false crossover. The difference between a 19-period and a 22-period MA on a daily ATRP chart is negligible. Move past it and focus on the volatility regime, not the perfect MA number.
How to Generate ATRP Pine Script in Pineify
Pineify lets you generate this exact ATRP indicator in seconds. You do not need to hand-edit the code unless you want to. Here is how.
- 1
Open Pineify and select the ATRP indicator.
Go to the indicator library, find ATRP under the Volatility category, and click Select.
- 2
Configure the ATR timeframe and lookback period.
Set the timeframe to 1D for daily charts and the lookback to 14. These defaults work for most swing trading setups.
- 3
Toggle the moving average smoothing on or off.
If you plan to use the MA crossover for volatility regime detection, keep it on. The default SMA at length 20 is a solid baseline.
- 4
Copy the generated Pine Script code.
Pineify produces v6-compatible code. Click the copy button or download the .pine file.
- 5
Paste into TradingView and adjust the visual settings.
Open the Pine Editor, paste the code, and click Add to Chart. The white ATRP line and green MA line appear in a separate pane below price.
Start Using ATRP on Your Charts Today
Generate the complete ATRP Pine Script in one click. No manual coding, no copy-paste errors. Just configure and trade.
Generate for FreeFrequently Asked Questions
Related Indicators
ATR Indicator
The raw Average True Range in absolute terms, for stop placement and position sizing.
ATR Band Indicator
Dynamic support and resistance levels based on ATR offsets from price.
Bollinger Bands Indicator
Standard deviation-based volatility bands that expand and contract with price action.
Keltner Channel Indicator
ATR-based volatility envelopes that contain price movements within a channel.
Chop Zone Indicator
Identifies ranging vs trending conditions using a normalised volatility calculation.