

Spread and executable depth
Check the current bid, ask, quoted size, and nearby order-book depth at your broker. A narrow closing median spread from the fund website does not prove that your order can fill at the same cost now.
The best ETF for day trading is liquid enough for your order, active enough for your setup, and tied to an exposure you understand. The answer can change from one session to the next.
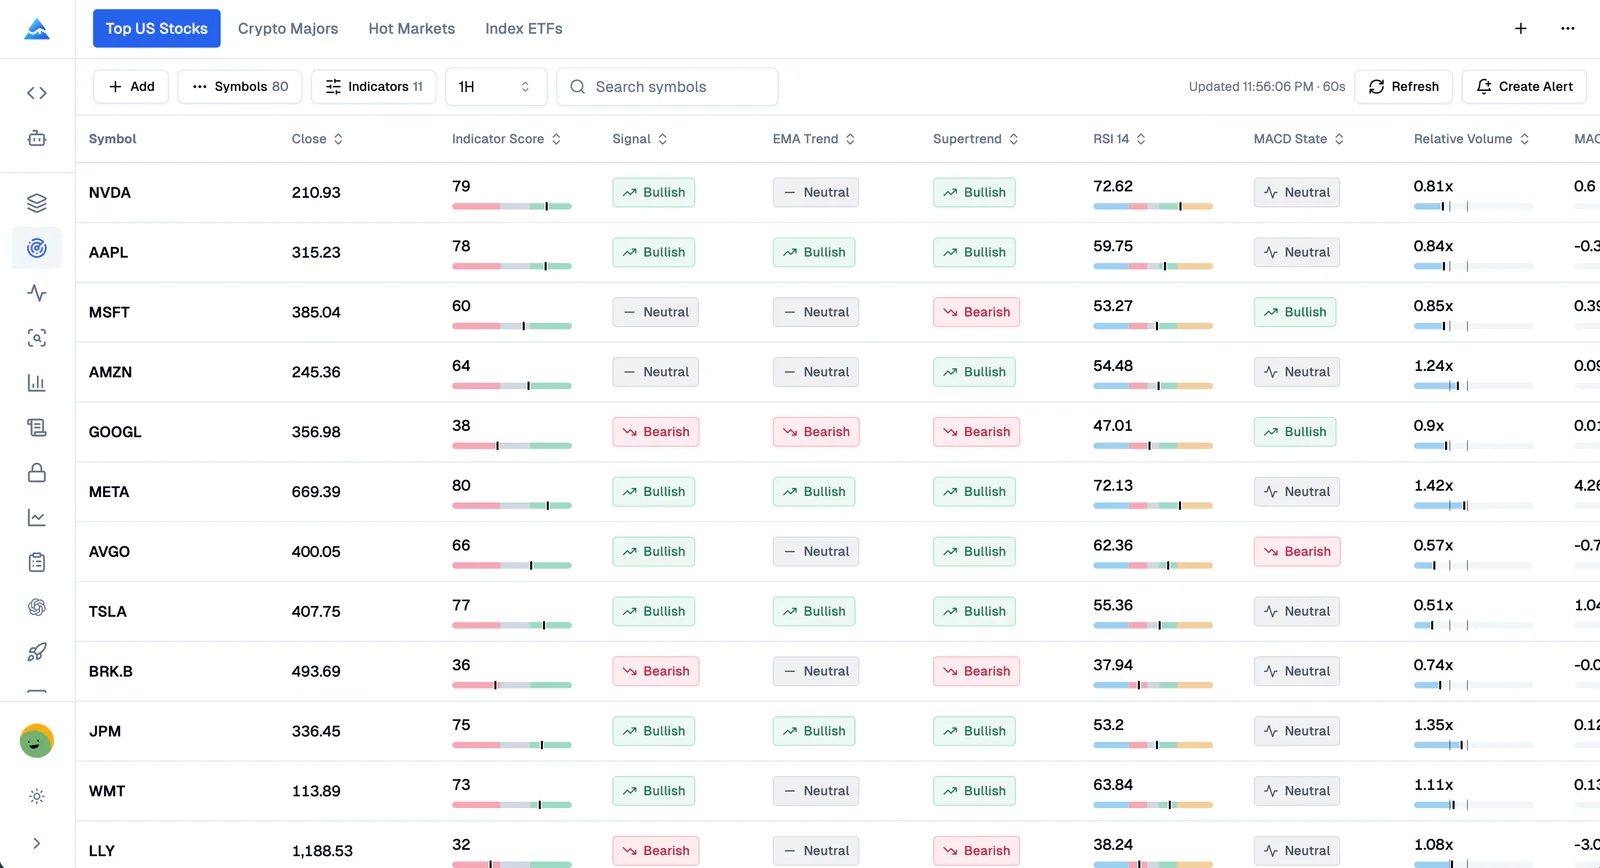
The screener narrows a research watchlist. Check the live spread, depth, fund objective, and order details at your broker before trading.
Index ETFs
Ready-to-review collection
8 timeframes
From 1 minute to 1 day
ATR and volume
Comparable technical fields
Starting candidates, not a ranking
A popular ticker is not automatically a good trade. Start with the market exposure behind the symbol, then apply the same liquidity and movement checks to every candidate.
| ETF | Exposure | When to compare it | Fund source |
|---|---|---|---|
| SPY | S&P 500 | A broad US large-cap starting point when the session is driven by market-wide news. | Official page |
| QQQ | Nasdaq-100 | A starting point when large nonfinancial Nasdaq companies are driving the session. | Official page |
| IWM | Russell 2000 | A small-cap benchmark to compare when risk appetite or domestic growth is the main theme. | Official page |
| XLF | S&P 500 financial sector | A sector-specific candidate when rates, banks, insurers, or capital markets are in focus. | Official page |
These examples describe fund exposure. They do not state which ETF is most liquid or most volatile at the moment you trade.
Four checks before a ticker stays on the list
A technical setup cannot repair a poor fill. Apply these checks before deciding whether the chart deserves more analysis.
Check the current bid, ask, quoted size, and nearby order-book depth at your broker. A narrow closing median spread from the fund website does not prove that your order can fill at the same cost now.
Compare ATR as a percentage of price, the current session range, and distance from the open. A high dollar ATR can be ordinary for an expensive ETF, so percentage terms make candidates easier to compare.
Use Relative Volume and current volume together. A fund can be active on average but quiet today, or unusually active because a scheduled event changed participation.
Know whether the fund represents the broad market, a sector, small caps, commodities, bonds, or a geared daily objective. The ticker is only useful when its exposure matches the trade idea.
A repeatable screen makes the result auditable. It also makes a skipped trade easier to explain after the market closes.
Open Market ScreenerStart with broad index ETFs, then add only the sector or asset-class funds connected to the session catalyst.
Use one consistent timeframe, such as 5 or 15 minutes, so every candidate is measured on the same basis.
Place ATR percentage, Relative Volume, performance, momentum, and trend fields side by side. Sort one field at a time and record why a ticker remains on the list.
Confirm the current spread, depth, news, fund objective, and order size outside the screener. Remove any candidate that fails the written execution limits.
Volatility needs context
A static list cannot capture a new gap, a sector headline, or a sudden volume shift. Rank the current session with ATR percentage, range, performance, and Relative Volume. Then remove anything that fails the spread, depth, and structure checks.
The SEC notes that an ETF can trade above or below its net asset value and that the bid-ask spread is a trading cost. The fund website can help with objective, holdings, historic premium/discount, and median spread data, but execution still depends on the current market.
Read the SEC ETF bulletinOnce the screener produces a shortlist, use Pineify AI Finance Agent to inspect ETF holdings, sector weights, expense ratios, fund flows, and related market context. That research explains what the ETF owns. It does not predict the next trade.
Day trading ETF questions
Each answer separates a selection rule from an investment or execution promise.
The best ETFs for day trading are the funds that meet your current spread, depth, movement, and exposure rules in that session. SPY, QQQ, IWM, and liquid sector ETFs are useful starting candidates, but none is automatically best every day.
Yes. ETF shares trade on exchanges during the day, but the market price can differ from net asset value and every trade still carries spread, slippage, fees, and market risk. Check the current quote and fund objective before placing an order.
There is no permanent most volatile ETF for day trading. Rank the current session with ATR percentage, range, gap, and Relative Volume, then remove funds whose spreads, depth, or structure make the movement impractical to trade.
ATR percentage and Relative Volume measure movement and participation. Trend, momentum, VWAP-related context, and short-period performance can describe the setup, but no indicator guarantees direction or a profitable fill.
Leveraged and inverse exchange-traded products can be used by traders who understand their daily objective, derivatives exposure, tracking risk, and possible losses. Most geared products reset daily, so their behavior over longer periods can differ sharply from a simple multiple of the benchmark.
Pineify Market Screener can compare supported ETFs with short intraday timeframes and technical fields such as Relative Volume and ATR percentage. It produces a research watchlist, not an order recommendation, and it does not replace a broker quote or order-book check.
Risk and fund-structure claims were checked on August 7, 2026. Live quotes and fund data can change after publication.
ETF market prices, NAV, bid-ask spreads, costs, holdings, and fund documents.
Daily reset objectives, tracking differences, and geared product risks.
Lower liquidity, partial fills, wider price swings, and venue differences outside regular hours.
Compare the same fields across the same universe, keep the session timestamp visible, and verify execution before the order.
This page is for information and research only. It is not investment advice. Day trading and ETF trading can result in substantial loss, and no screener or indicator guarantees a future return or fill.