TradingView indicator calculations

Zig Zag indicator: separate pivot price from confirmation time

The Zig Zag indicator compresses price history into alternating swing highs and lows. TradingView filters pivots by a percentage reversal and a left/right confirmation window. A line anchored to an earlier candle became available later, and its latest endpoint can still move. Treat the drawing as a changing description of swings, not an entry timestamp.

Build a Zig Zag inspection script

Specify which Zig Zag you are checking

This page follows the current TradingView built-in documentation and the official TradingView/ZigZag library v9 release notes, checked October 17, 2026. Library v8 moved to Pine Script v6; v9 replaced extendLast with projectionPivots. The old extension to the latest price and the v9 search for a potential pivot are different behaviors. Do not transfer settings from an unrelated community script by name alone.

  • For the worked example, use a 5% deviation, Pivot legs = 4, and projections off. Evaluate only completed bars with positive prices.
  • The library update() result can mean either a new line or a changed last line. A true result alone is not a new reversal signal.
Apply the pivot test before the deviation test

TradingView uses floor(Pivot legs / 2) bars on each side. Highs must exceed the left highs and match or exceed the right highs; lows use the inverse comparisons. An opposite pivot meeting the deviation threshold adds a segment. A more extreme pivot of the same type replaces the endpoint. Other candidates are ignored.

  • The formula here assumes a positive last price. Specify zero and negative-price handling before extending this fixture to other instruments.
  • A threshold crossing alone does not satisfy the two-right-bar test. Both conditions must be checked.
Calculation in this exampleResult
Left bars = right bars = floor(4 / 2)2 bars each side
Reversal magnitude = 100 × abs(new price − last price) / last priceCompare with 5% after the pivot test
Drop from 110 to 106 = 100 × 4 / 1103.6364%; reject the opposite pivot
Drop from 114 to 106 = 100 × 8 / 1147.0175%; accept the opposite pivot

The 16-bar input fixture

These are invented high and low prices in arbitrary price units, not market data. Start with no saved pivots and require two available bars on each side. Opens and closes can lie anywhere inside each range; only highs and lows enter this calculation. The first two bars provide left-side history.

BarHighLow
1105103
2104102
3102100
4104102
5107105
6110108
7109107
8108106
9109107
10112110
11114112
12112110
13110108
14108106
15109107
16110108

What was available at each completed bar?

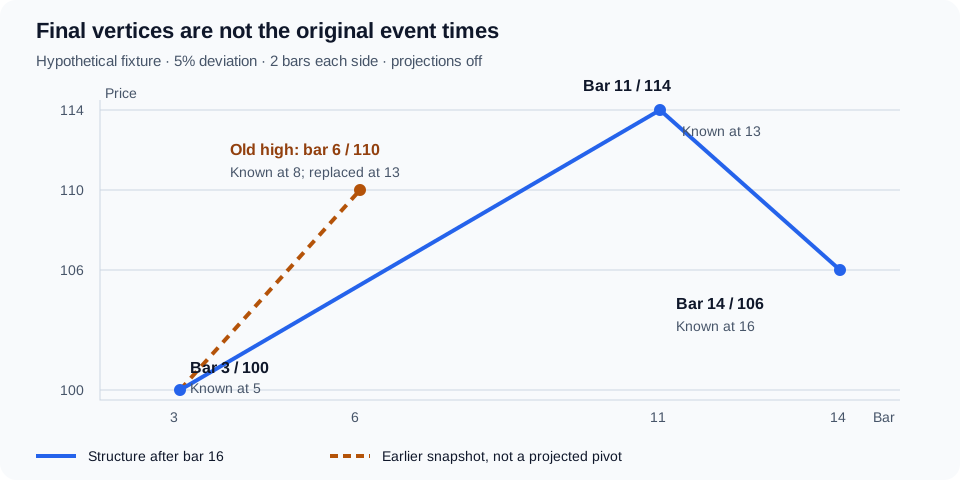
The event log below is derived from the fixture. At bar 8 the visible segment ends at bar 6. At bar 11 that endpoint remains unchanged with projections off: the new high at 114 still lacks its two right bars. Only at bar 13 can the saved endpoint move to bar 11. The final chart no longer shows the earlier endpoint at bar 6.

Hypothetical Zig Zag: the bar 6 high known at bar 8 is replaced by the bar 11 high at bar 13; the bar 14 low is accepted at bar 16.
Original fixture diagram. Blue is the structure after bar 16. Orange dashes preserve the earlier snapshot for comparison; they are not TradingView projected pivots. View original source
  • The final vertices sit at bars 3, 11, and 14. Their first acceptance times in this fixture are bars 5, 13, and 16.
  • A simulated entry at the bar 11 high would use information unavailable at that time. An event emitted at bar 13 still needs a separate execution rule and fill assumption.
Observed at closeCandidate and decisionSaved structure after evaluation
5Bar 3 low = 100 passes its left/right test; initializeLow at bar 3; no segment yet
8Bar 6 high = 110; rise from 100 is 10%3:100 → 6:110
10Bar 8 low = 106; drop from 110 is only 3.6364%3:100 → 6:110; unchanged
11High = 114 is visible, but the bar 11 pivot is unconfirmed3:100 → 6:110; unchanged
13Bar 11 high = 114 confirms; replace the previous high3:100 → 11:114
16Bar 14 low = 106 confirms; drop from 114 is 7.0175%3:100 → 11:114 → 14:106

Replay the updates, then test projections separately

TradingView warns that the latest solid segment can be redrawn. With projections enabled, a dashed candidate can also change or disappear. Disabling projections removes that candidate display; it does not freeze the last solid endpoint.

  • On your chosen symbol, save the timeframe, session, script version, deviation, and pivot legs. Start replay before the swing under inspection.
  • Advance one completed bar at a time. Record observation time, pivot time, pivot price, and whether the operation added or replaced an endpoint.
  • Capture the intermediate structure before advancing. Compare those snapshots with the final drawing; a final screenshot cannot preserve a removed endpoint.
  • Repeat with projections enabled and label provisional events separately. The hypothetical table above covers only projections off, not intrabar projection behavior.

Give Pineify an observable calculation contract

Ask the Pine Script AI Coding Agent to draft a Zig Zag inspection script with separate outputs for pivot location, detection time, and endpoint replacement. Use the fixture as a manual acceptance check before adding alerts or strategy orders.

  • Pin the implementation or library version. State high/low inputs, deviation, left/right lengths, projection policy, and how to handle a candle that qualifies as both a high and a low.
  • Keep an event log when a candidate is accepted or replaced. Plotting a label at the old pivot bar must not backdate the event timestamp.
  • Request syntax validation, then compare per-bar values and operation types. Define entries, exits, sizing, execution timing, and costs separately; a swing compression rule is not a complete strategy.
Where Pineify fits

Pine Script AI Coding Agent

Turn a written Zig Zag rule into inspectable Pine Script. Specify when pivots become available and compare generated behavior with the fixture before using alerts.

Build a Zig Zag inspection script

Frequently asked questions

Educational indicator analysis, not investment advice. The prices and diagram are hypothetical. No backtest or trading performance is reported, and a confirmed local pivot does not guarantee a reversal or profit.

Sources and verification

Published by Pineify. Pineify is an independent product and is not affiliated with TradingView. Sources support the technical explanations; examples do not establish trading performance.