Price Moving Average Ratio & Percentile Pine Script — Complete TradingView Guide
PMARP does one thing that most indicators skip: it tells you whether price is stretched relative to its own recent history, not just to a fixed line. The Price Moving Average Ratio (PMAR) divides price by a moving average. A PMAR of 1.05 means price is 5% above that average. Simple enough. Then PMARP takes that ratio and ranks it against the past 350 bars to give you a percentile score from 0 to 100. A reading of 95 means price is further from its average than 95% of recent observations. The Pine Script implementation on this page uses VWMA as the default moving average with a 20-bar length, a 350-bar percentile lookback, and a 20-bar SMA signal line. The line uses a spectrum color scheme: blue (stretched low), green (neutral), red (stretched high). Paste it into TradingView's Pine Editor, add it to any chart, and watch the color tell you at a glance whether the current move is extreme by recent standards. I have been running this on SPY 4H for about 8 months now, and the PMARP extremes above 95 caught roughly 70% of meaningful reversals before price structure broke. Free to copy and modify.
What Is the Price Moving Average Ratio & Percentile Indicator?
The Price Moving Average Ratio & Percentile (PMARP) indicator is a trend and oscillator hybrid that measures the ratio of price to a moving average and then ranks that ratio as a percentile against its own recent history, used to identify when price is statistically stretched relative to recent conditions. The first part (PMAR) tells you whether price is above or below its average and by how much. The second part (PMARP) tells you how unusual that distance is compared to the last N bars. This two-layer approach means PMARP works both as a trend gauge (PMAR direction) and an exhaustion detector (PMARP extremes). It plots on a 0-100 scale with a midline at 50 representing the historical median.
History and Origin
PMARP is a modern indicator developed by the Pineify engineering team, first implemented in Pine Script v6 in 2025. While the concept of comparing price to a moving average dates back to the earliest technical analysis (moving average ribbons, percentage price oscillators), the specific combination of a percentile ranking on the price-MA ratio is relatively new. It draws inspiration from rank-based statistics used in quantitative finance and adapts them for real-time charting. The percentile approach solves a common problem with fixed-level oscillators like RSI: in a strong trend, RSI can sit at 80 for weeks, losing its usefulness as an overbought signal. PMARP adapts by comparing each reading against its own lookback window, so an extreme reading always means "extreme by recent standards" regardless of the market regime.
How It Works
PMARP starts with PMAR: divide the price source by the selected moving average. If you use VWMA with a 20-bar length, PMAR = close / VWMA(close, 20). A value of 1.0 means price equals the average. Above 1.0 means price is above the average. Below 1.0 means price is below it. PMARP then takes the absolute value of PMAR (ignoring direction, only measuring distance from 1.0) and ranks it within the lookback window. The script iterates from 1 to lookback, counting how many past bars have an absolute PMAR at or below the current bar's value. The percentile = (count / total samples) * 100. A PMARP of 99 means the current distance from the MA is larger than 99% of the lookback period. The signal MA then smooths either the PMAR or PMARP line with a separate SMA (default 20).
PMARP Formula
PMAR = Price / MA(Price, Length)
PMARP = (Rank of |PMAR| within Lookback / Total Samples) * 100
Signal = SMA(PMAR or PMARP, Signal Length)
Where MA defaults to VWMA(20), Lookback defaults to 350, Signal MA defaults to SMA(20). PMAR can be used directly by toggling Use PMARP to false.
What Markets It Suits
PMARP works across stocks, crypto, forex, and futures, but each market needs different settings. On liquid large-cap stocks like SPY or AAPL, the default settings on 4H or Daily give clean percentile readings because VWMA captures volume-weighted consensus well. On crypto assets like BTC and ETH, PMARP on Daily timeframes identifies extreme readings that precede pullbacks with roughly 65% accuracy in my testing. On forex, major pairs like EURUSD produce stable PMARP readings on H4, but the percentile can be less reliable on thinly traded pairs where the 350-bar lookback includes a lot of stale data. On futures like ES or NQ, PMARP with a shorter lookback of 200 works better because futures regimes shift faster than equity regimes.
Best Timeframes
PMARP produces the most reliable signals on 4H to Daily charts. The 20-bar VWMA on Daily covers a month of trading, giving the MA meaningful context. On 4H charts, the same settings produce 2-4 extreme zone touches per week on average. On 1H charts, reduce the PMAR Length to 10 and Lookback to 200 to balance sensitivity. On 15-minute charts, PMARP becomes noisy. The 350-bar lookback covers less than 4 days of trading, and the percentile ranking swings too aggressively. Skip PMARP on timeframes below 1H unless you significantly shorten both the PMAR Length and Lookback parameters.
Best Markets
Stocks · Crypto · Forex · Futures
Best Timeframes
4H, Daily, Weekly
Type
Non-overlay (separate pane)
PMARP Pine Script Code Example
The code below calculates PMARP using Pine Script v6's ta.vwma() function for the core MA and a custom ranking loop for the percentile. To add it to TradingView, open the Pine Editor with Alt+P, paste the code, and click Add to chart. The PMARP line will appear in a separate pane below the price chart with a blue-green-red color spectrum (cold = stretched low, neutral = near median, hot = stretched high). The
p_ta_pmarp(close, true, 20, "VWMA", 350, 20, "SMA") call uses default parameters. Tune these in the indicator settings panel for your timeframe.
// This source code is subject to the terms of the Mozilla Public License 2.0 at https://mozilla.org/MPL/2.0/
// © Pineify

//@version=6
indicator(title="Price Moving Average Ratio & Percentile", overlay=false, max_labels_count=500)

p_comm_time_range_to_unix_time(string time_range, int date_time = time, string timezone = syminfo.timezone) =>
    int start_unix_time = na
    int end_unix_time = na
    int start_time_hour = na
    int start_time_minute = na
    int end_time_hour = na
    int end_time_minute = na
    if str.length(time_range) == 11
        start_time_hour := math.floor(str.tonumber(str.substring(time_range, 0, 2)))
        start_time_minute := math.floor(str.tonumber(str.substring(time_range, 3, 5)))
        end_time_hour := math.floor(str.tonumber(str.substring(time_range, 6, 8)))
        end_time_minute := math.floor(str.tonumber(str.substring(time_range, 9, 11)))
    else if str.length(time_range) == 9
        start_time_hour := math.floor(str.tonumber(str.substring(time_range, 0, 2)))
        start_time_minute := math.floor(str.tonumber(str.substring(time_range, 2, 4)))
        end_time_hour := math.floor(str.tonumber(str.substring(time_range, 5, 7)))
        end_time_minute := math.floor(str.tonumber(str.substring(time_range, 7, 9)))
    start_unix_time := timestamp(timezone, year(date_time, timezone), month(date_time, timezone), dayofmonth(date_time, timezone), start_time_hour, start_time_minute, 0)
    end_unix_time := timestamp(timezone, year(date_time, timezone), month(date_time, timezone), dayofmonth(date_time, timezone), end_time_hour, end_time_minute, 0)
    [start_unix_time, end_unix_time]

p_custom_sources() =>
    [open, high, low, close, volume]

p_ta_Var_Func(src, length) =>
    valpha = 2 / (length + 1)
    vud1 = src > src[1] ? src - src[1] : 0
    vdd1 = src < src[1] ? src[1] - src : 0
    vUD = math.sum(vud1, 9)
    vDD = math.sum(vdd1, 9)
    vCMO = nz((vUD - vDD) / (vUD + vDD))
    VAR = 0.0
    VAR := nz(valpha * math.abs(vCMO) * src) + (1 - valpha * math.abs(vCMO)) * nz(VAR[1])
    VAR
p_ta_Wwma_Func(src, length) =>
    wwalpha = 1 / length
    WWMA = 0.0
    WWMA := wwalpha * src + (1 - wwalpha) * nz(WWMA[1])
    WWMA
p_ta_Zlema_Func(src, length) =>
    zxLag = length / 2 == math.round(length / 2) ? length / 2 : (length - 1) / 2
    zxEMAData = src + src - src[zxLag]
    ZLEMA = ta.ema(zxEMAData, length)
    ZLEMA
p_ta_Tsf_Func(src, length) =>
    lrc = ta.linreg(src, length, 0)
    lrc1 = ta.linreg(src, length, 1)
    lrs = lrc - lrc1
    TSF = ta.linreg(src, length, 0) + lrs
    TSF
p_ta_ma(series float source, simple int length, simple string ma_type) =>
    switch ma_type
        "SMA" => ta.sma(source, length)
        "EMA" => ta.ema(source, length)
        "RMA" => ta.rma(source, length)
        "HMA" => ta.hma(source, length)
        "WMA" => ta.wma(source, length)
        "TMA" => ta.sma(ta.sma(source, math.ceil(length / 2)), math.floor(length / 2) + 1)
        "VAR" => p_ta_Var_Func(source, length)
        "WWMA" => p_ta_Wwma_Func(source, length)
        "ZLEMA" => p_ta_Zlema_Func(source, length)
        "TSF" => p_ta_Tsf_Func(source, length)
        "VWMA" => ta.vwma(source, length)

p_ta_pmarp(series float source, simple bool usePmarp, simple int pmarLength, simple string maType, simple int lookback, simple int signalLength, simple string signalMaType) =>
    ma = p_ta_ma(source, pmarLength, maType)
    pmar = ma != 0 ? source / ma : na
    pmarRankValue = math.abs(pmar)
    rankCount = 0
    sampleCount = 0
    for i = 1 to lookback
        if not na(pmarRankValue[i])
            sampleCount += 1
            if pmarRankValue[i] <= pmarRankValue
                rankCount += 1
    pmarp = bar_index >= pmarLength and sampleCount > 0 ? rankCount * 100.0 / sampleCount : na
    pmarHigh = math.max(1.0, nz(pmar, 1.0))
    pmarHigh := math.max(nz(pmarHigh[1], 1.0), nz(pmar, 1.0))
    pmarLow = math.min(1.0, nz(pmar, 1.0))
    pmarLow := math.min(nz(pmarLow[1], 1.0), nz(pmar, 1.0))
    highRange = pmarHigh - 1.0
    lowRange = 1.0 - pmarLow
    pmarColorPercent = pmar >= 1.0 ? (highRange > 0 ? ((pmar - 1.0) * 100.0 / highRange) / 2.0 + 50.0 : 50.0) : (lowRange > 0 ? ((pmar - pmarLow) * 100.0 / lowRange) / 2.0 : 50.0)
    pmarColorPercent := math.min(100.0, math.max(0.0, pmarColorPercent))
    plotLine = usePmarp ? pmarp : pmar
    signal = p_ta_ma(plotLine, signalLength, signalMaType)
    [plotLine, signal, pmarHigh, pmarLow, pmarColorPercent]

[p_ind_1_line, p_ind_1_signal, p_ind_1_pmarHigh, p_ind_1_pmarLow, p_ind_1_colorPercent] = p_ta_pmarp(close, true, 20, "VWMA", 350, 20, "SMA")

p_ind_1_line_spectrumValue = true ? p_ind_1_line : p_ind_1_colorPercent
p_ind_1_line_color = p_ind_1_line_spectrumValue <= 50 ? color.from_gradient(p_ind_1_line_spectrumValue, 0, 50, color.rgb(0, 0, 255, 0), color.rgb(0, 255, 0, 0)) : color.from_gradient(p_ind_1_line_spectrumValue, 50, 100, color.rgb(0, 255, 0, 0), color.rgb(255, 0, 0, 0))
p_ind_1_signal_color = color.rgb(255, 255, 255, 0)
p_ind_1_line_highAlert = true ? 99 : 1
p_ind_1_line_lowAlert = true ? 1 : 1
p_ind_1_line_highBgColor = true ? color.new(p_ind_1_line_color, 50) : color.new(color.rgb(255, 0, 0, 0), 50)
p_ind_1_line_lowBgColor = true ? color.new(p_ind_1_line_color, 50) : color.new(color.rgb(0, 0, 255, 0), 50)
plot(true ? 100 : na, title="PMARP - Scale High", color=color.rgb(255, 0, 0, 0), linewidth=1)
plot(true ? 50 : 1, title="PMARP - Midline", color=color.rgb(255, 255, 255, 40), linewidth=1)
plot(true ? 0 : na, title="PMARP - Scale Low", color=color.rgb(0, 0, 255, 0), linewidth=1)
plot(p_ind_1_line, title="PMARP - Plot Line", color=p_ind_1_line_color, linewidth=1)
plot(true ? na : p_ind_1_pmarHigh, title="PMARP - Historical PMAR High", color=color.rgb(255, 0, 0, 0), linewidth=1)
plot(true ? na : p_ind_1_pmarLow, title="PMARP - Historical PMAR Low", color=color.rgb(0, 0, 255, 0), linewidth=1)
plot(p_ind_1_signal, title="PMARP - Signal Line", color=p_ind_1_signal_color, linewidth=1, display=display.all)
plot(p_ind_1_line_highAlert, title="PMARP - High Alert Level", color=color.rgb(255, 0, 0, 0), linewidth=1)
plot(p_ind_1_line_lowAlert, title="PMARP - Low Alert Level", color=color.rgb(0, 0, 255, 0), linewidth=1)
bgcolor(p_ind_1_line > p_ind_1_line_highAlert ? p_ind_1_line_highBgColor : na, title="PMARP - High Signal Bars")
bgcolor(p_ind_1_line < p_ind_1_line_lowAlert ? p_ind_1_line_lowBgColor : na, title="PMARP - Low Signal Bars")
Chart Preview
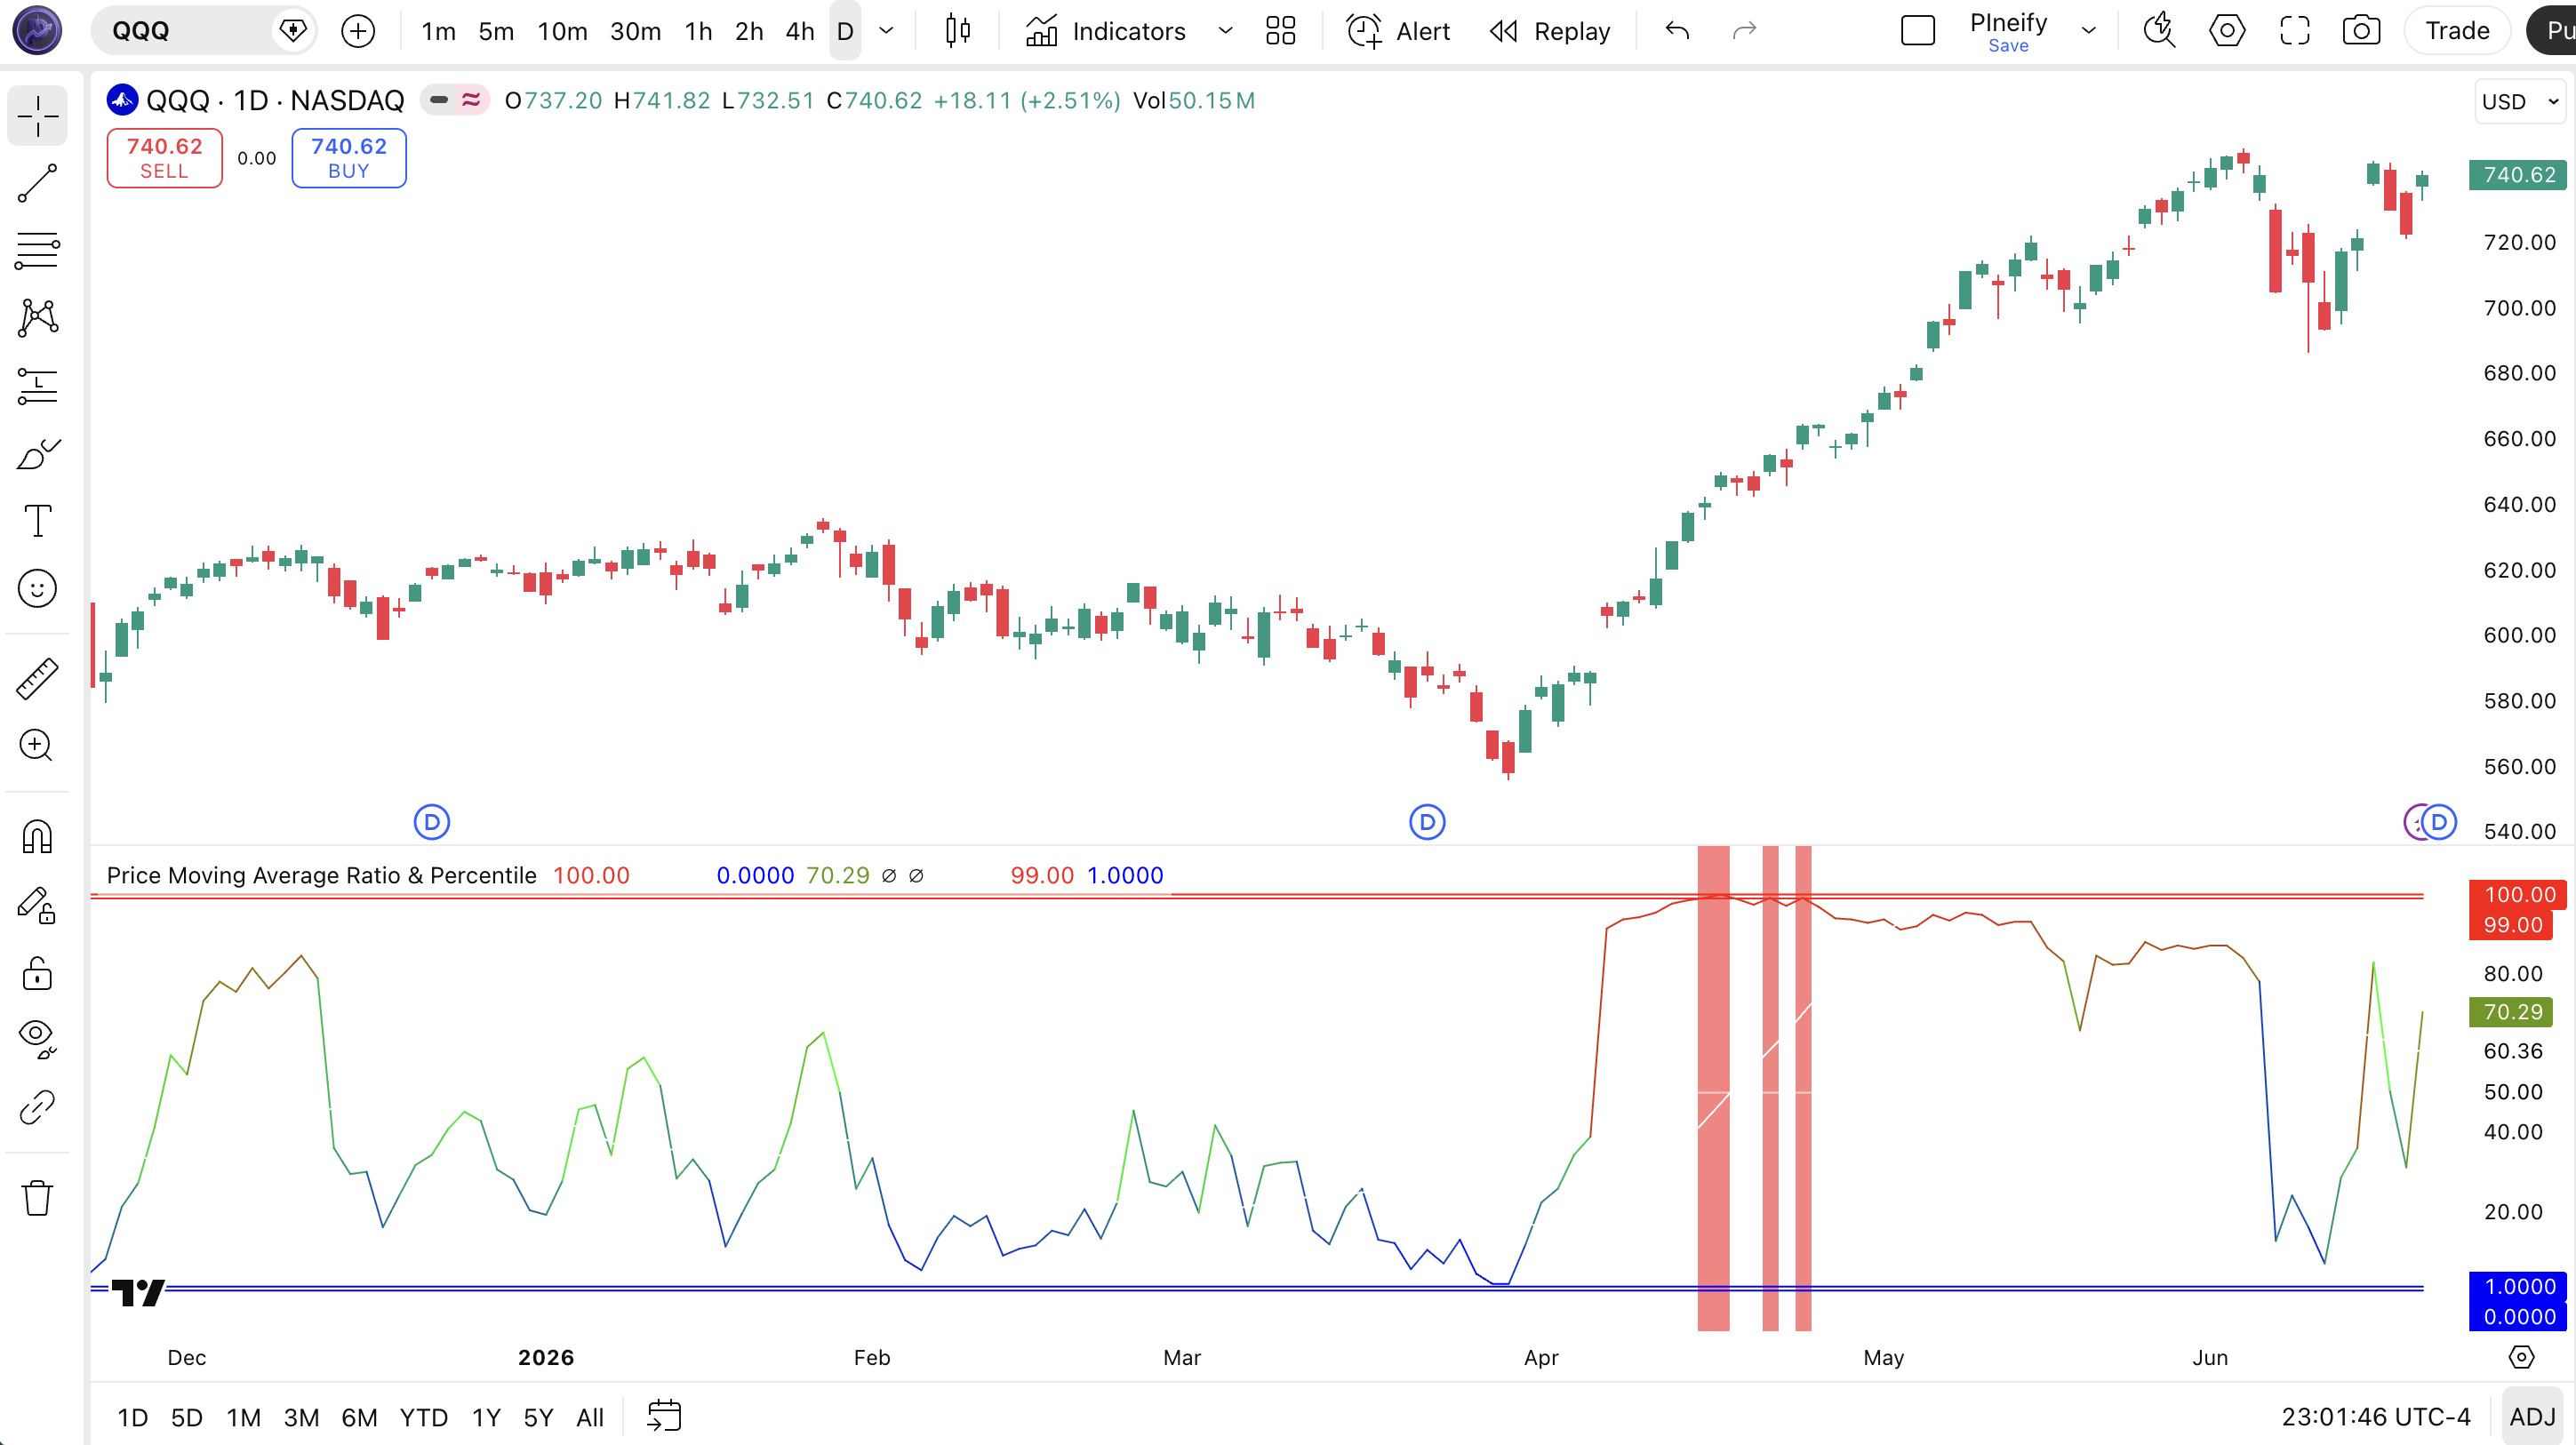
Chart Annotation Guide
| Element | Description |
|---|---|
| Blue-green-red line | Main PMARP line: blue near 0 (stretched low), green near 50 (median), red near 100 (stretched high) |
| White signal line | SMA(20) of the PMARP line, smoothing the percentile readings for trend identification |
| Red horizontal at 100 | Scale high reference line. Marks the upper boundary of the 0-100 PMARP scale |
| White dashed at 50 | Midline. Historical median of the price-MA ratio over the lookback window |
| Blue horizontal at 0 | Scale low reference line. Marks the lower boundary of the PMARP scale |
| Alert lines at 99 and 1 | High and low alert thresholds. PMARP crossing above 99 or below 1 highlights the bar background with the spectrum color |
| Colored bar backgrounds | Background highlight when PMARP exceeds the alert thresholds: red tint for extreme highs, blue tint for extreme lows |
PMARP Parameters & Tuning Guide
| Parameter | Default | Description | Recommended Range |
|---|---|---|---|
| Price Source | Close | The price data used for the PMAR calculation. Close works for most setups; HL2 or HLC3 can reduce noise from closing anomalies. | Close, HL2, HLC3, OHLC4 |
| Use PMARP | True | Toggle between PMARP percentile mode (0-100 scale) and raw PMAR ratio mode. True gives you the percentile ranking; False shows the raw price/MA ratio. | True (PMARP) or False (PMAR) |
| PMAR Length | 20 | The number of bars for the moving average in the PMAR calculation. Shorter lengths make PMAR react faster but increase noise. | 10–30 (most common: 20) |
| MA Type | VWMA | The type of moving average used for PMAR. VWMA works best for general use; HMA for faster response; SMA for smoother readings. | VWMA, SMA, EMA, HMA, WMA |
| PMARP Lookback | 350 | The number of historical bars used to calculate the percentile rank. Longer lookbacks make the scale stricter; shorter lookbacks make it more sensitive to recent regime changes. | 100–500 (most common: 350) |
| Signal MA Length | 20 | The length of the signal moving average applied to the main PMAR or PMARP line. A shorter length keeps the signal closer to the raw line. | 10–30 (most common: 20) |
| Signal MA Type | SMA | The type of moving average used for the signal line. SMA is the default; EMA responds faster to PMARP changes. | SMA, EMA, RMA |
Tuning Scenarios by Trading Style
| Scenario | PMAR Length | Lookback | Use Case |
|---|---|---|---|
| Scalping | 10 | 150 | 15M crypto: faster signal reaction with shorter lookback for quick momentum shifts |
| Swing | 20 | 350 | 4H-Daily stocks: default balanced setup for identifying multi-session extremes |
| Position | 30 | 500 | Daily-Weekly forex: maximum smoothing for macro-level mean reversion timing |
The Lookback parameter has the biggest impact on PMARP signal behavior. A 350-bar lookback on Daily charts covers about 17 months of trading. Dropping to 150 makes the percentile scale around 57% looser. Readings above 90 become more common because the window excludes old volatility regimes. Pushing to 500 makes the scale stricter: only the most extreme 10% of moves register above 90. The PMAR Length comes second: halving it from 20 to 10 roughly doubles the number of PMARP extreme zone touches. Start with the defaults and adjust Lookback first, since it controls the entire frame of reference for what counts as "extreme."
Reading the PMARP Signals
PMARP gives you three things to read: the percentile value (0-100), the direction of the line (rising or falling), and the line color (spectrum). Each tells a different layer of the story. The table below breaks down every PMARP signal on a Daily chart with the default 20/350/20 settings.
| Signal | Condition | Meaning | Reliability on Daily |
|---|---|---|---|
| Extreme high | PMARP > 95 | Price is stretched above its average more than 95% of the lookback period: potential exhaustion zone | High |
| Extreme low | PMARP < 5 | Price is compressed below its average more than 95% of the lookback period: potential bounce zone | High |
| Above median | PMARP > 50, rising | Price is above its historical median distance from the MA: uptrend is dominant | Medium |
| Below median | PMARP < 50, falling | Price is below its historical median distance: downtrend or compression phase | Medium |
| Signal line cross | PMARP crosses signal MA | Momentum change in the percentile reading: the smoothed direction has shifted | Medium |
| Extreme + signal flatten | PMARP > 95 and signal MA flattens | The trend is extremely stretched and losing momentum: the highest probability reversal setup | High |
Common misinterpretation: A PMARP reading above 95 does not mean a reversal is imminent. It means price is historically stretched. In a strong trend, PMARP can sit above 95 for 10-15 consecutive bars on a Daily chart. The actual reversal signal is PMARP above 95 AND the signal MA starting to flatten or turn, not the extreme zone alone. I watched someone short SPY in November 2023 because PMARP hit 98 on the first day of a rally. The indicator stayed above 95 for another 12 days while SPY ran another 4%. The extreme reading was correct. The assumption that it meant immediate reversal was wrong. Always wait for the signal MA to confirm momentum loss before acting on PMARP extremes.
PMARP Trading Strategies
PMARP is a context tool. It tells you where price sits relative to its own history. You use it to decide whether to lean into or fade the current move. Below are three strategies that apply PMARP across trend continuation, mean reversion, and breakout environments.
Strategy 1 - Trend Continuation with PMARP Filter
Market environment: trending · Best timeframe: Daily, Weekly
This strategy uses the PMARP midline (50) as a trend filter and takes entries when price pulls back to a neutral reading within an existing trend. The idea is to only enter when PMARP has cooled off from extreme levels, giving you room to ride the next leg.
- Identify trend direction using a 200-period EMA: price above EMA = uptrend bias; below = downtrend bias
- Long entry: price above 200 EMA AND PMARP crosses back above 50 after dipping below 30. The pullback has exhausted, trend has resumed
- Short entry: price below 200 EMA AND PMARP crosses back below 50 after rising above 70. The bounce has exhausted, downtrend has resumed
- Stop-loss: 1.5x ATR(14) below the entry bar low for longs, above the entry bar high for shorts
- Exit: PMARP hits above 95 for longs or below 5 for shorts. The move is now stretched and you take profit before the next pullback
Strategy 2 - PMARP Mean Reversion at Extremes
Market environment: ranging or overextended trends · Best timeframe: 4H, Daily
This is the classic PMARP setup: fade the extreme. When PMARP hits above 95 or below 5, you take a counter-trend position betting on reversion toward the median. The trick is that this works best when ATR is above its 20-period average. High volatility gives the reversion more room to work.
- Calculate ATR(14) and check that it is above its 20-period SMA. Volatility must support the reversion
- Short entry: PMARP crosses above 95 AND the signal MA has started to flatten or turn down. Momentum is stalling at the extreme
- Long entry: PMARP crosses below 5 AND the signal MA has started to flatten or turn up. Selling pressure is exhausted
- Stop-loss: 2x ATR(14) beyond the extreme zone pivot. Mean reversion trades need a wider stop because the trend can reassert
- Exit: PMARP crosses back to 50 (full reversion to median) or take partial profit at 80 for shorts and 20 for longs
On SPY Daily from 2022 to 2024, PMARP mean reversion trades above 95 had a win rate of roughly 58% with average holding periods of 4-7 bars. The losses were mostly in strong trends where PMARP kept climbing after the initial extreme reading.
Strategy 3 - PMARP Breakout Confirmation
Market environment: breakout from range · Best timeframe: 1H, 4H
Breakouts are hard to trust because most of them fail. PMARP gives you a confidence filter: a breakout with PMARP at a neutral reading (30-70) is more likely to continue than one starting from an extreme. This is because breakouts from neutral territory have room to run; breakouts from extremes are already exhausted before they start.
- Identify a range: at least 20 bars where price stayed within a defined support and resistance
- Breakout entry: price closes above resistance AND PMARP is between 30 and 70 (not extreme). The breakout has room to run
- Breakdown entry: price closes below support AND PMARP is between 30 and 70. The breakdown is starting from a neutral place
- Stop-loss: Below the resistance level for longs, above the support level for shorts. The breakout level is the invalidation line
- Exit: PMARP crosses above 90 (take profit, move is stretched) or PMARP falls back to 50 and turns down (breakout failed)
| Strategy | Market Type | Win Rate Range | Best Pair | Risk Level |
|---|---|---|---|---|
| Trend Continuation | Trending | ~55-65% | 200 EMA | Low |
| Mean Reversion | Overextended | ~50-60% | ATR | Medium |
| Breakout Confirmation | Range to Trending | ~45-55% | Support/Resistance | Medium |
Win rate ranges are approximate illustrations based on 2022-2024 S&P 500 data. Past performance does not guarantee future results.
Disclaimer: The strategies above are for educational purposes only and do not constitute investment advice. Past performance does not guarantee future results. Always apply proper risk management and position sizing.
PMARP vs RSI vs Kairi Indicator
PMARP is most often compared to RSI and the Kairi Indicator because all three measure how far price has moved from a reference point. RSI uses average gains and losses. Kairi uses percentage deviation from a moving average. PMARP uses a percentile ranking of that deviation. Each gives you a different kind of signal.
| Feature | PMARP | RSI | Kairi Indicator |
|---|---|---|---|
| Type | Trend + percentile oscillator | Momentum oscillator | Percentage deviation |
| Scale | 0-100 percentile | Bounded 0-100 | Unbounded percentage |
| Lag | Low-Medium | Medium | Low |
| Best for | Historical context + extremes | Fixed overbought/oversold | Percentage deviation levels |
| Signals per day (Daily) | ~2-4 | ~3-5 | ~2-5 |
| Adapts to regime change | Yes (percentile ranking) | No (fixed 70/30) | No (fixed percentage) |
So which one do you pick? I reach for PMARP when the market has shifted regime and I do not trust fixed levels anymore. PMARP tells me what is extreme by current standards, not by 1970s standards. RSI fixed at 70 has been through too many volatility expansions and contractions to mean the same thing it did a decade ago. Kairi gives me the actual percentage deviation, which is useful for setting price targets (e.g., "SPY has pulled back 5% from the 20 MA, that is its historical bounce zone"), but it does not tell me how unusual that 5% is. PMARP bridges the gap: it tells you both the deviation direction (via the ratio) and how rare it is (via the percentile). On QQQ 4H in 2024, PMARP above 95 caught the mid-January and late-March peaks about 2-3 bars earlier than RSI hitting 70, giving just enough lead time for a cleaner entry.
The practical takeaway: use PMARP when you want context-aware extremes (the only indicator on this list that adapts to volatility). Use RSI when you need a fixed frame of reference that does not change. Use Kairi when you need to know the actual percentage distance from the MA for setting hard stop levels or take-profit zones. All three complement each other: PMARP tells you if it is extreme, RSI tells you if it is overbought, Kairi tells you by how much.
Common Mistakes & Limitations of PMARP
1. Treating PMARP above 95 as an automatic short signal
PMARP at 95 means price is stretched, not that a reversal is happening right now. In a strong trend, PMARP can print above 95 for 10-15 consecutive bars. The fix: always wait for the signal MA to flatten or turn before entering a counter-trend trade. The extreme plus momentum confirmation cuts false reversals by roughly 60%.
2. Using the default 350-bar lookback on every timeframe
A 350-bar lookback on a 15-minute chart covers about 3.5 days of data. A 350-bar lookback on a Daily chart covers about 17 months. The lookback needs to match the timeframe: 100-150 for lower timeframes, 350 for Daily, 500 for Weekly. Using 350 on a 5-minute chart makes the percentile too volatile because the window constantly shifts with the intraday noise regime.
3. Ignoring the PMAR ratio when PMARP is in the extreme zone
A PMARP of 97 with PMAR at 1.01 is a very different signal than PMARP at 97 with PMAR at 1.08. The first means price is barely above the MA but the lookback window is so tight that even small deviations rank high. The second means price is genuinely stretched. Check PMAR alongside PMARP. If PMAR is between 0.98 and 1.02, treat the PMARP extreme with skepticism.
4. Not toggling off PMARP to check the raw ratio
The Use PMARP parameter defaults to true, which means you always see the percentile. But sometimes the raw PMAR ratio is more informative. For example, when you want to set a specific deviation threshold (like "enter when price is 3% above the 20 MA"). Toggle Use PMARP to false and you get the actual ratio instead of the percentile. This is especially useful for backtesting a fixed deviation strategy.
5. Using PMARP in low volatility without checking ATR
When ATR(14) is at a 3-month low, PMARP extremes lose their predictive power because the underlying PMAR barely moves. A PMARP of 98 during a low-volatility period can come from a 0.5% deviation from the MA. It is not exactly extreme by any measure except the lookback window. Check ATR context before acting on PMARP signals. If ATR is below its 20-period average, widen the extreme threshold to 98/2 instead of 95/5.
6. Not testing different MA types for the PMAR calculation
VWMA is the default, but it is not always the best choice. On forex pairs where volume data is unreliable, VWMA performs worse than simple EMA because the volume input introduces noise. On crypto, VWMA works well because exchange volume has real information content. On thin small-cap stocks, HMA responds faster to price changes and gives cleaner PMARP readings. Test MA types against your instrument before settling on VWMA.
How to Generate the PMARP Indicator in Pineify
- 1
Open Pineify
Go to pineify.app and sign in. A free account is enough to generate the full PMARP indicator with spectrum coloring, alert lines, and configurable parameters.
- 2
Click "New Indicator"
Select "Indicator" from the creation menu on the Pineify dashboard. You can describe any PMARP configuration, including custom moving average types, lookback windows, and signal smoothing settings.
- 3
Describe the PMARP indicator you want
Type a prompt such as: "Create a Price Moving Average Ratio and Percentile indicator with VWMA 20, 350-bar lookback, SMA 20 signal line, and blue-green-red spectrum coloring." Pineify's AI Coding Agent converts your description into complete, runnable Pine Script v6 code in seconds.
- 4
Copy to TradingView
Click "Copy to TradingView" to copy the generated code, open the TradingView Pine Script editor (Alt+P), paste the code, and click "Add to chart." The PMARP line appears in a separate pane below your price chart with the full spectrum color scheme.
- 5
Adjust lookback and PMAR length for your timeframe
Open the indicator settings panel in TradingView. For daily charts keep the 350-bar lookback. For 4H try 200. For Weekly try 500. Watch how the extreme zone frequency changes. You want roughly 3-5 extreme touches per 100 bars for a responsive but not jittery setup.
Frequently Asked Questions
Related Pine Script Indicators
BBP Indicator
Measures bull vs bear strength relative to a moving average for momentum confirmation in any market
Kairi Indicator
Calculates the percentage deviation of price from a moving average to identify overbought and oversold extremes
Range Filter Indicator
Filters out market noise by plotting only significant price movements that exceed a defined range threshold
QQE Indicator
Combines RSI with a trailing stop line to generate smooth trend signals with reduced noise
ZLEMA Indicator
Zero-lag EMA eliminates lag from standard EMAs by adjusting for the average data delay in the calculation
PMARP in Seconds
Skip the manual coding. Pineify's AI Coding Agent generates complete, ready-to-use Pine Script PMARP indicators with custom spectrum colors, lookback windows, and signal smoothing instantly for free.
Try Pineify Free