Parabolic SAR Pine Script — Complete TradingView Guide
The Parabolic SAR (Stop and Reverse) is a trend-following overlay indicator built into Pine Script v6 that places dots above or below price to signal trend direction and mark dynamic stop-loss levels. Developed by J. Welles Wilder Jr. in 1978, the Parabolic SAR uses an Acceleration Factor (AF) that starts at 0.02 and increases by 0.02 each time price sets a new extreme high or low, capped at a maximum of 0.2 to prevent the SAR from chasing price too aggressively. In Pine Script v6, the indicator is generated with the single built-in function ta.sar(start, increment, maximum). This guide covers the complete implementation, every configurable parameter with recommended ranges, three concrete Parabolic SAR trading strategies including SAR + EMA and SAR + ADX combinations, plus a five-step workflow to generate Parabolic SAR scripts instantly with Pineify.
What Is the Parabolic SAR?
The Parabolic SAR is a price-overlay trend indicator that calculates a series of stop-and-reverse price levels, used to identify trend direction, time exits from existing positions, and set trailing stop-loss levels in trending markets. Unlike oscillators such as RSI or MACD that plot in a separate panel, the Parabolic SAR appears directly on the price chart as dots: dots below price signal an uptrend, and dots above price signal a downtrend. When price crosses the SAR level, the indicator flips to the opposite side — signalling a Stop and Reverse (hence the name SAR).
Developed by J. Welles Wilder Jr. in 1978 and first published in his landmark book New Concepts in Technical Trading Systems, the Parabolic SAR was originally designed to track trailing stops in commodity futures markets. Wilder designed the indicator with a parabolic arc to accelerate the stop-loss as a trend matures, capturing more profit early in a trend while tightening the stop as the trend ages.
Core formula: The SAR for the next bar is calculated as SAR(n+1) = SAR(n) + AF × (EP − SAR(n)), where SAR(n) is the current SAR value, AF is the Acceleration Factor (starts at 0.02 and increments by 0.02 each time a new extreme point is recorded), and EP is the Extreme Point — the highest high in an uptrend or the lowest low in a downtrend. The AF is capped at a maximum of 0.2 (10 increments), preventing the SAR from accelerating too close to price and generating premature reversals. In Pine Script v6, this entire calculation is encapsulated in ta.sar(start, increment, maximum).
The Parabolic SAR applies to all liquid asset classes: stocks, cryptocurrency, forex, and futures. It performs best on Daily and 4H timeframes where trends have time to develop. On intraday charts (15m, 1H), the SAR generates more reversals due to short-term noise and benefits from a reduced AF (start = 0.01, increment = 0.01). In ranging or sideways markets, the Parabolic SAR generates frequent false signals and should always be used alongside a trend-strength filter such as ADX (Average Directional Index) — only act on SAR signals when ADX is above 25 to confirm a trend is in place.
Best Markets
Stocks · Crypto · Forex · Futures
Best Timeframes
4H, Daily, Weekly
Overlay
Yes — plots directly on price chart
Parabolic SAR Pine Script Code Example
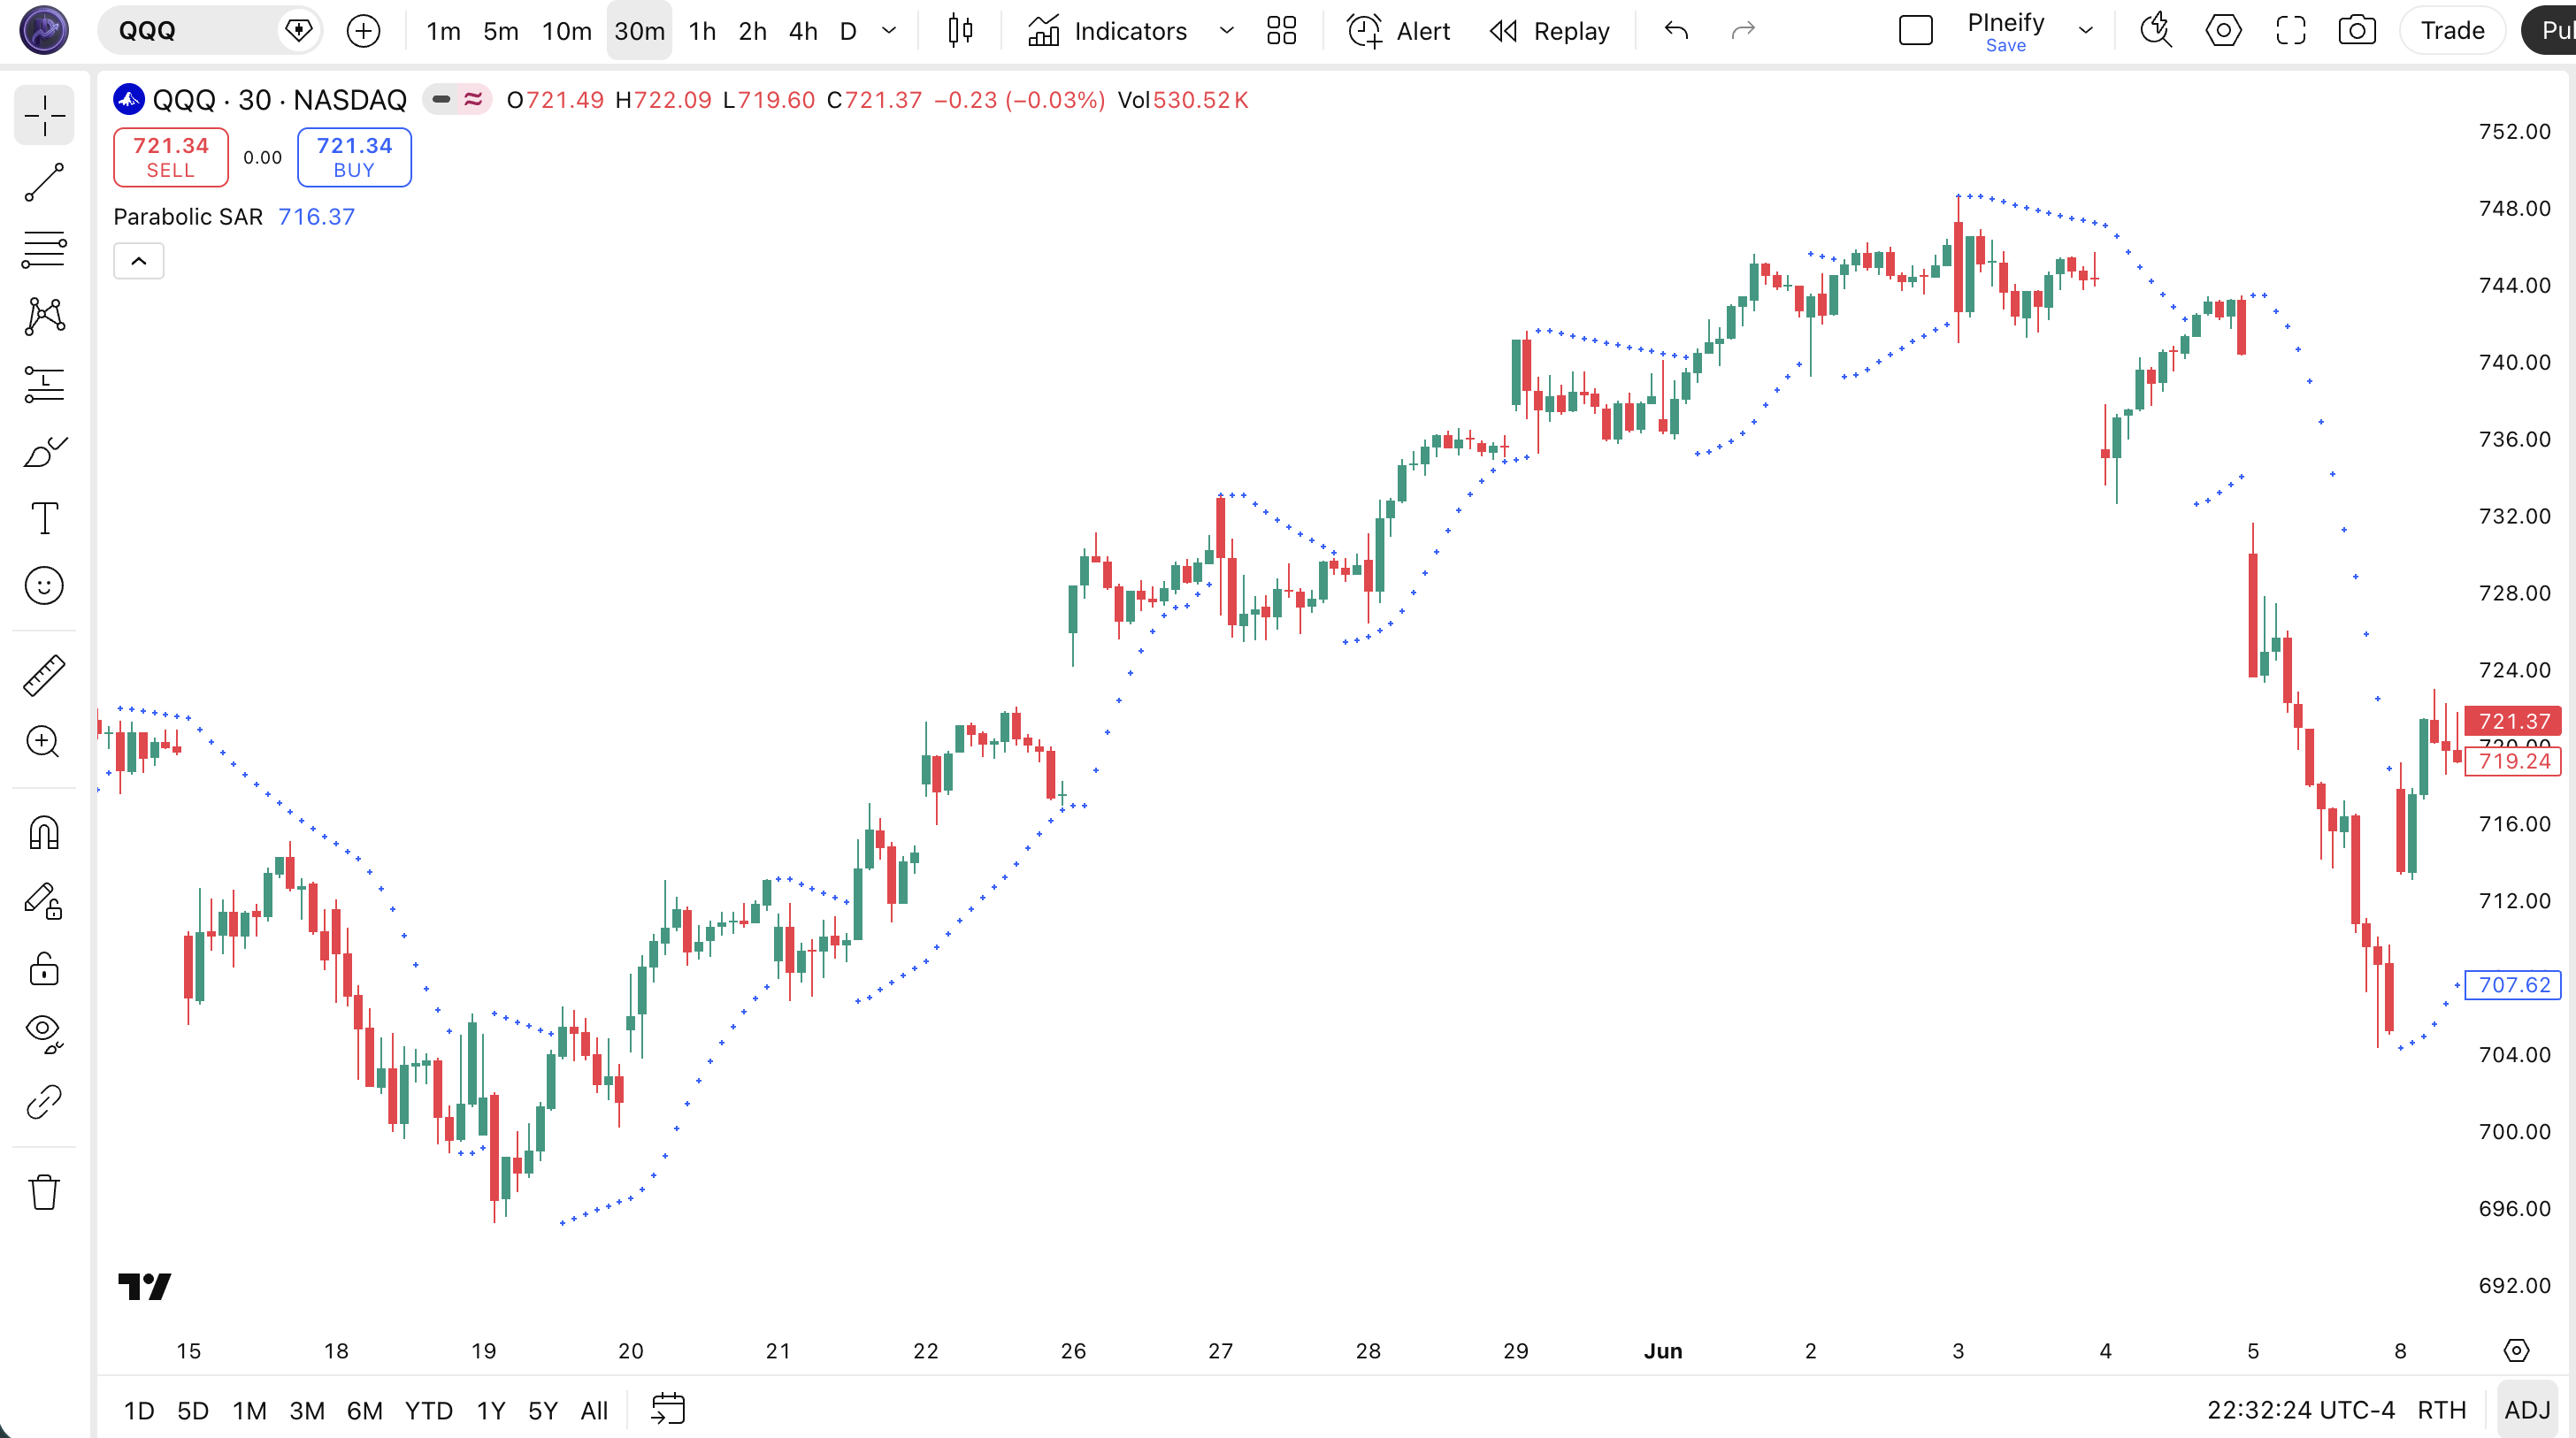
The code below calculates and plots the Parabolic SAR indicator as crosses directly on the TradingView price chart using Pine Script v6. The implementation uses the native ta.sar() function with Wilder's standard parameters — start 0.02, increment 0.02, maximum 0.2. To add it to TradingView, open the Pine Script editor with Alt+P, paste the code, and click Add to chart — blue crosses will appear below price in an uptrend and above price in a downtrend.
// This source code is subject to the terms of the Mozilla Public License 2.0 at https://mozilla.org/MPL/2.0/
// © Pineify

//@version=6
indicator(title="Parabolic SAR", overlay=true, max_labels_count=500)

// Parabolic SAR — calculated with ta.sar(start, increment, maximum)
// start:     initial Acceleration Factor (AF) = 0.02
// increment: AF step size each time a new extreme point is set = 0.02
// maximum:   AF cap to prevent SAR from accelerating too fast = 0.2
p_ind_1 = ta.sar(0.02, 0.02, 0.2) // SAR

// Plot SAR as crosses on the price chart (overlay=true)
// Blue crosses above price = downtrend; blue crosses below price = uptrend
plot(p_ind_1, "SAR", color.rgb(41, 98, 255, 0), 1, style=plot.style_cross)
Chart Preview
Parabolic SAR Parameters
| Parameter | Default Value | Description | Recommended Range |
|---|---|---|---|
| start | 0.02 | The initial Acceleration Factor (AF) value when a new trend begins. A lower start value keeps the SAR further from price at the start of a trend, reducing early false reversals. | 0.005 – 0.04 |
| increment | 0.02 | The step added to the AF each time price sets a new Extreme Point. Controls how quickly the SAR accelerates toward price as the trend matures. Smaller values produce more gradual acceleration. | 0.005 – 0.04 |
| maximum | 0.2 | The cap on the Acceleration Factor. Once AF reaches this value, it stops increasing. A lower maximum keeps the SAR further from price on long-running trends, letting winners run with a wider stop. | 0.1 – 0.4 |
Tuning Guide by Trading Style
- Scalping (5m–15m charts): start 0.005, increment 0.005, maximum 0.1 — very slow acceleration keeps SAR away from noisy price action
- Day trading (15m–1H charts): start 0.01, increment 0.01, maximum 0.1 — reduced sensitivity for intraday timeframes; fewer false reversals
- Swing trading (4H–Daily charts): start 0.02, increment 0.02, maximum 0.2 (Wilder default) — the most tested and widely used setting for medium-term trends
- Position trading (Daily–Weekly charts): start 0.02, increment 0.02, maximum 0.1 — lower maximum lets the SAR trail further behind on long-running trends, reducing premature exits
Parabolic SAR Trading Strategies
The Parabolic SAR generates its most reliable signals as a trend-following and trailing stop tool. It performs best when paired with a trend-direction filter (EMA) or a trend-strength filter (ADX) to eliminate false Stop and Reverse signals in sideways or low-momentum markets.
Strategy 1 — Parabolic SAR + EMA Trend Filter
Market environment: trending markets · Best timeframe: 4H, Daily
Using the Parabolic SAR with a 50-period EMA as a trend direction filter eliminates the majority of counter-trend SAR flips. Only take long SAR signals when price is above EMA 50 and only take short SAR signals when price is below EMA 50. This combination is highly effective on Daily charts for stocks and crypto.
- Calculate Parabolic SAR:
sarValue = ta.sar(0.02, 0.02, 0.2) - Calculate trend direction:
ema50 = ta.ema(close, 50) - Long entry: SAR flips below price (
ta.crossunder(sarValue, close)) AND close > ema50 - Short entry: SAR flips above price (
ta.crossover(sarValue, close)) AND close < ema50 - Exit / Stop: trail stop at the SAR value each bar until SAR flips to the opposite side
Strategy 2 — Parabolic SAR + ADX Trend Strength Filter
Market environment: strongly trending markets · Best timeframe: 4H, Daily
Adding an ADX (14) filter ensures SAR signals only fire during strong trends. Require ADX above 25 before acting on any SAR flip. This dramatically reduces whipsaws in low-momentum or consolidating markets. Particularly effective for forex major pairs and crypto on 4H charts.
- Calculate SAR:
sarValue = ta.sar(0.02, 0.02, 0.2) - Calculate ADX (14) using Directional Movement smoothed with
ta.rma() - Trend confirmation condition: ADX > 25 (strong trend in place — direction is confirmed by SAR position)
- Long entry: ADX > 25 AND SAR flips below price on the current bar
- Exit: SAR flips above price OR ADX drops below 20 (trend weakening — close position before a full reversal)
Strategy 3 — Parabolic SAR Trailing Stop on Momentum Breakout
Market environment: breakouts from consolidation · Best timeframe: Daily
Enter a breakout trade using a price or volume signal, then use the Parabolic SAR as an automated trailing stop. This lets the trade ride the full trend while automatically tightening the stop as the trend accelerates. Effective on Daily charts for high-momentum stocks and crypto.
- Identify consolidation: price ranging in a tight band for 5+ bars with ATR below its 20-bar average
- Breakout trigger: price closes above the highest high of the last 20 bars on above-average volume
- Entry: enter long at next bar open after the breakout candle close
- Calculate trailing stop:
stopLevel = ta.sar(0.02, 0.02, 0.2)— place stop-loss at this value each bar - Exit: stop-loss is triggered when price touches the SAR level (SAR flips above price)
Disclaimer: The strategies above are for educational purposes only and do not constitute investment advice. Past performance does not guarantee future results. Always apply proper risk management and position sizing.
How to Generate the Parabolic SAR Indicator in Pineify
- 1
Open Pineify
Go to pineify.app and sign in — a free account gives you full access to the AI Coding Agent, which generates ready-to-paste Pine Script v6 code with no setup required.
- 2
Click "New Indicator"
Select "Indicator" as the script type from the creation menu on the Pineify dashboard to start the AI generation workflow.
- 3
Describe the Parabolic SAR configuration you want
Type a prompt such as: "Create a Parabolic SAR overlay indicator with start 0.02, increment 0.02, maximum 0.2. Plot crosses on the price chart and add a long signal when SAR flips below price." Pineify's AI generates the complete Pine Script v6 code in seconds, including all necessary ta.sar() calls.
- 4
Copy the generated script to TradingView
Click "Copy to TradingView" in Pineify to copy the code, then open the TradingView Pine Script editor (Alt+P), paste the code, and click "Add to chart". The Parabolic SAR dots appear immediately on the price chart.
- 5
Adjust the Acceleration Factor settings
In the TradingView indicator settings panel, change start, increment, and maximum to match your trading style — use 0.01/0.01/0.1 for intraday charts or keep the Wilder defaults 0.02/0.02/0.2 for daily swing trading. No code editing needed.
Frequently Asked Questions
Related Pine Script Indicators
Build Your Parabolic SAR Indicator in Seconds
Skip the manual coding. Pineify's AI Coding Agent generates complete, ready-to-use Pine Script indicators — including Parabolic SAR with EMA filtering and ADX confirmation — instantly for free.
Try Pineify Free