Keltner Channel Pine Script — Complete TradingView Guide
Keltner Channel is a volatility envelope indicator in Pine Script that plots three lines on your TradingView chart: a 20-period EMA as the middle line, and upper and lower bands set 2 × ATR(10) above and below the EMA. Developed by Chester Keltner in 1960 and refined by Linda Bradford Raschke in the 1980s, the Keltner Channel uses Average True Range to produce smoother, more stable bands than standard deviation-based envelopes. Traders use Keltner Channels to identify breakout momentum, trend continuation, and the famous Squeeze setup when Bollinger Bands contract inside the Keltner Channel. The indicator works across all asset classes — stocks, crypto, forex, and futures — on timeframes ranging from 15-minute intraday to daily position-trading charts. This complete guide covers the full Pine Script v6 implementation using ta.kc(), all configurable parameters, three proven trading strategies, and step-by-step instructions for generating your customized Keltner Channel script instantly with Pineify.
What Is the Keltner Channel?
The Keltner Channel is a volatility-based envelope indicator that uses an Exponential Moving Average as the center line and Average True Range (ATR) to set the upper and lower bands, used to identify trend direction, breakout momentum, and mean-reversion opportunities. Chester W. Keltner first described the indicator in his 1960 book How to Make Money in Commodities, using a 10-period simple moving average with a fixed price-range band. In the 1980s, Linda Bradford Raschke popularized the modern version that replaces the simple range with ATR, producing channels that adapt more accurately to true market volatility.
The three components of the Keltner Channel are:
- Middle Line: A 20-period EMA of the closing price. Formula:
middle = EMA(close, 20) - Upper Band: Middle line plus ATR multiplied by the multiplier. Formula:
upper = EMA(close, 20) + 2 × ATR(10) - Lower Band: Middle line minus ATR multiplied by the multiplier. Formula:
lower = EMA(close, 20) − 2 × ATR(10)
The ATR-based width is what distinguishes Keltner Channels from Bollinger Bands. Because ATR measures the average range of price bars (including gaps), it responds to real volatility events without being distorted by a single extreme price bar the way standard deviation can be. This means the channel contracts and expands more gradually, making it easier to distinguish genuine trend moves from short-lived volatility spikes.
One of the most cited uses of the Keltner Channel is the Squeeze indicator, developed by John Carter. The Squeeze fires when Bollinger Bands (standard deviation-based) fit entirely inside the Keltner Channel (ATR-based). This compression indicates that both raw price volatility and smoothed range volatility are at low levels — a condition historically followed by a high-magnitude directional move.
Keltner Channels are applicable across all liquid markets: equities (individual stocks, ETFs, indices), cryptocurrency (BTC, ETH, SOL and major altcoins), forex (EUR/USD, GBP/JPY, AUD/USD), and futures (ES, NQ, crude oil, gold). They perform best on timeframes from 15-minute to Daily charts. Weekly charts reveal major structural support and resistance zones defined by the channel bands.
Best Markets
Stocks · Crypto · Forex · Futures
Best Timeframes
15m, 1H, 4H, Daily
Overlay
Yes — plots directly on price chart
Keltner Channel Pine Script Code
The Pine Script v6 code below uses ta.kc(close, 20, 2, true) to plot the complete Keltner Channel overlay — EMA center line, upper band, lower band, and a semi-transparent blue fill — directly on the TradingView price chart. To add it, open the TradingView Pine Script editor (Alt+P), paste the code below, and click Add to chart. You can adjust the length and multiplier arguments inside ta.kc() without modifying the rest of the script.
// This source code is subject to the terms of the Mozilla Public License 2.0 at https://mozilla.org/MPL/2.0/
// © Pineify
//@version=6
indicator(title="Keltner Channel", overlay=true, max_labels_count=500)
// Keltner Channel calculation using ta.kc()
// Parameters: source=close, length=20, mult=2, usetruerange=true
// Middle: 20-period EMA of close
// Upper/Lower: EMA ± 2 × ATR(10)
[p_ind_1_middle, p_ind_1_upper, p_ind_1_lower] = ta.kc(close, 20, 2, true) // KC
// Plot the three channel lines
plot(p_ind_1_middle, "KC - Middle", color.rgb(41, 98, 255, 0), 1)
p_ind_1_upper_plot = plot(p_ind_1_upper, "KC - Upper", color.rgb(41, 98, 255, 0), 1)
p_ind_1_lower_plot = plot(p_ind_1_lower, "KC - Lower", color.rgb(41, 98, 255, 0), 1)
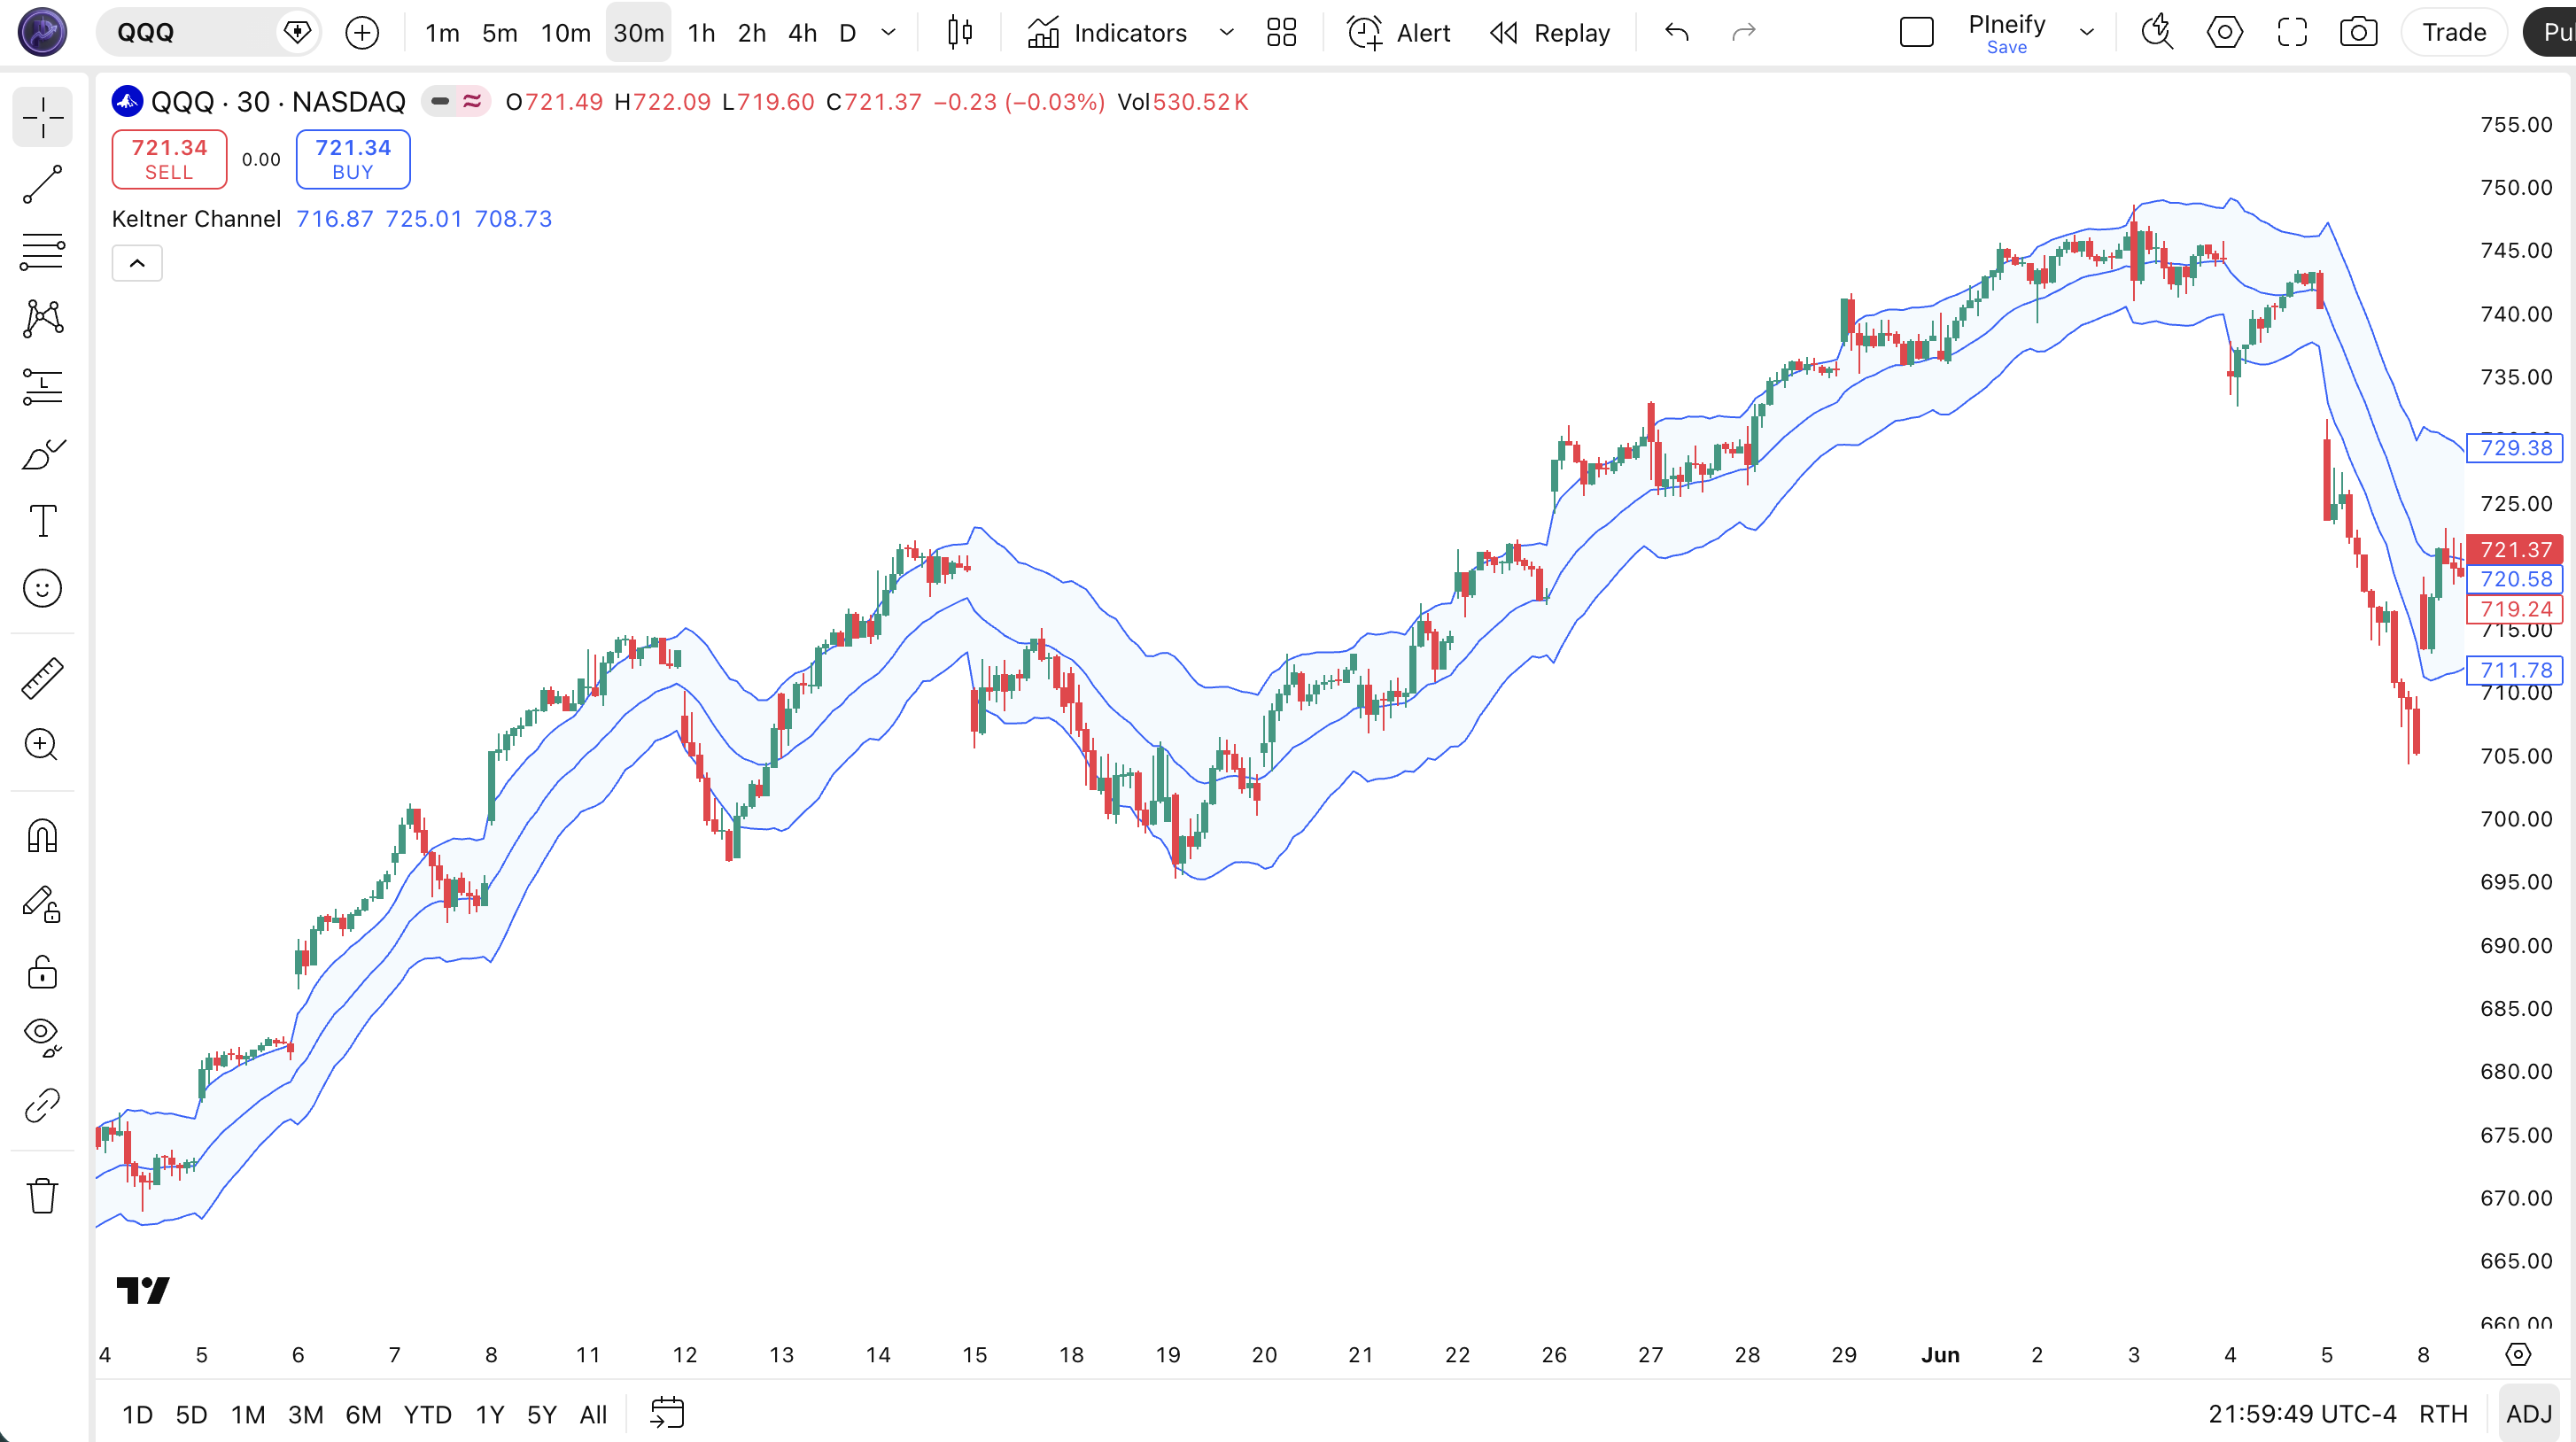
fill(p_ind_1_upper_plot, p_ind_1_lower_plot, title = "KC - Channel", color=color.rgb(33, 150, 243, 95))Chart Preview
Keltner Channel Parameters
| Parameter | Default Value | Description | Recommended Range |
|---|---|---|---|
| length | 20 | The number of bars used to calculate the EMA middle line. Higher values produce a smoother channel that responds more slowly to price changes; lower values react faster. | 10–50 (20 is standard for daily charts) |
| mult | 2.0 | The ATR multiplier that determines how far the upper and lower bands are from the EMA. A higher multiplier widens the channel, reducing false breakout signals. | 1.0–3.0 (2.0 standard; 1.5 for scalping) |
| source | close | The price series used to compute the EMA middle line. Most traders use close; some prefer hlc3 (typical price) for smoother signals. | close (standard) or hlc3 |
| useTrueRange | true | When true, uses True Range (accounting for gaps) for ATR calculation. Set to false to use high−low only, which ignores overnight gaps. | true (recommended for all markets) |
Tuning Guide by Trading Style
- Scalping (5m–15m charts): length 10, mult 1.5 — tighter bands catch fast intraday breakouts
- Day trading (1H charts): length 20, mult 2.0 — the standard settings for hourly breakout strategies
- Swing trading (4H–Daily charts): length 20, mult 2.0–2.5 — wider bands reduce false breakout signals on multi-day moves
- Position trading (Daily–Weekly charts): length 50, mult 2.5 — slow channel identifies major structural breakouts and trend changes
Keltner Channel Trading Strategies
The Keltner Channel generates three categories of signals: breakouts beyond the upper or lower band, trend-continuation entries using the EMA as dynamic support, and the Squeeze setup using Bollinger Bands as a companion indicator. The following strategies use numbered entry and exit conditions for precise implementation.
Strategy 1 — Keltner Channel Breakout
Market environment: low-volatility consolidation into a directional breakout · Best timeframe: 1H, 4H, Daily
A close outside the Keltner Channel bands signals that price has exceeded the "normal" volatility range, indicating institutional momentum. Pair with ta.macd() histogram to confirm breakout direction and avoid counter-trend fades.
- Calculate the channel:
[middle, upper, lower] = ta.kc(close, 20, 2, true) - Long entry: current close > upper band AND MACD histogram > 0 (bullish momentum confirmed)
- Short entry: current close < lower band AND MACD histogram < 0 (bearish momentum confirmed)
- Target: 1.5× ATR(10) beyond the entry price in the breakout direction
- Stop loss: close back inside the channel (close crosses back through the broken band)
Strategy 2 — EMA Pullback with Keltner Support
Market environment: established trending markets · Best timeframe: 4H, Daily
In trending markets, the Keltner Channel middle EMA acts as dynamic support (uptrend) or resistance (downtrend). Price pulling back to the EMA within the channel provides low-risk trend-continuation entries. Combine with RSI(14) staying above 50 to confirm the trend is intact.
- Confirm uptrend: close > EMA(50) on the same timeframe AND RSI(14) > 50
- Wait for pullback: price retraces to the middle EMA without breaking the lower band
- Long entry: close bounces back above the middle EMA after touching it
- Target: upper Keltner band
- Stop loss: close below the lower Keltner band (trend invalidated)
Strategy 3 — Keltner-Bollinger Squeeze
Market environment: extreme low-volatility compression before major expansion · Best timeframe: Daily, Weekly
The Squeeze fires when Bollinger Bands (length 20, mult 2.0) contract inside the Keltner Channel (length 20, mult 1.5). This dual-compression condition — popularized by John Carter — historically precedes the highest-magnitude directional moves. Pair with momentum oscillator direction to determine entry side.
- Calculate both channels:
[kc_mid, kc_up, kc_dn] = ta.kc(close, 20, 1.5, true)and[bb_basis, bb_up, bb_dn] = ta.bb(close, 20, 2.0) - Detect Squeeze:
squeeze = bb_up < kc_up and bb_dn > kc_dn - Wait for Squeeze to release (next bar where condition is false)
- Long entry: squeeze released AND close > kc_up AND momentum histogram rising
- Stop loss: close back below kc_mid (middle EMA)
Disclaimer: The strategies above are for educational purposes only and do not constitute investment advice. Past performance does not guarantee future results. Always apply proper risk management and position sizing.
How to Generate Keltner Channel in Pineify
- 1
Open Pineify
Go to pineify.app and sign in — a free account gives full access to the AI Coding Agent. No credit card required.
- 2
Click "New Indicator"
Select "Indicator" as the script type from the creation menu. Pineify will open the AI coding workspace ready for your description.
- 3
Describe your Keltner Channel setup
Type a prompt such as: "Add a Keltner Channel with a 20-period EMA, ATR multiplier of 2, and a blue fill between the bands." You can also request the Squeeze detection or a custom multiplier for scalping.
- 4
Copy the generated script to TradingView
Click "Copy to TradingView" to copy the full Pine Script v6 code, then paste it into the TradingView Pine Script editor (Alt+P) and click "Add to chart" to see the channel live.
- 5
Adjust parameters in TradingView settings
Open the indicator settings panel in TradingView to change the EMA length (default 20) and ATR multiplier (default 2.0) without editing code. Try length 10 and mult 1.5 for scalping or length 50 for position trading.
Frequently Asked Questions
Related Pine Script Indicators
Build Your Keltner Channel Script in Seconds
Skip the manual coding. Pineify's AI Coding Agent generates complete, ready-to-use Pine Script Keltner Channel indicators — including Squeeze detection, ATR multiplier tuning, and EMA pullback strategies — instantly for free.
Try Pineify Free