Momentum Pine Script — Complete TradingView Guide
The Momentum indicator in Pine Script measures the rate of price change by calculating the difference between the current closing price and the closing price a set number of bars ago using ta.mom(close, 10). A positive Momentum value signals upward price acceleration, while a negative value signals downward pressure. Momentum is one of the oldest and most widely cited oscillators in technical analysis, appearing in every major trading platform and extensively used across stocks, crypto, forex, and futures markets. In TradingView, ta.mom() is a built-in Pine Script v6 function that plots as a zero-line oscillator, making it straightforward to identify momentum crossovers, divergences, and trend continuation signals. Pineify lets you generate a customised Momentum script in seconds without writing code.
What Is the Momentum Indicator?
The Momentum indicator is a rate-of-change oscillator that measures the speed of price movement, used to identify trend strength, reversals, and divergences in financial markets. The concept of measuring price momentum was popularised by Martin Pring in his 1991 book Technical Analysis Explained, though the underlying principle — comparing current price to a prior price — dates back to early 20th-century market analysis.
The core formula is straightforward:
Momentum = Current Close − Close[length]
Where Current Close is the closing price of the current bar and Close[length] is the closing price length bars ago. In Pine Script v6 this is implemented as ta.mom(source, length). The result oscillates around zero: values above zero indicate that price is higher than it was length bars ago (bullish momentum), while values below zero indicate price is lower (bearish momentum).
Markets and Timeframes
The Momentum indicator is applicable to all liquid asset classes:
- Stocks and equity indices — Daily and weekly Momentum scans are widely used for stock screening and index rotation strategies.
- Cryptocurrency — 4-hour and 1-hour Momentum on BTC/USD and ETH/USD captures fast momentum cycles driven by sentiment shifts.
- Forex — Daily Momentum on major pairs (EUR/USD, GBP/USD) identifies directional bias for swing and position traders.
- Futures — Momentum on commodity futures (oil, gold, grain) helps quantify trend strength across contract cycles.
For intraday scalping, a length of 5–8 bars on 1–5 minute charts highlights rapid momentum bursts. For swing trading, a length of 10–20 bars on 1-hour or daily charts provides clear directional bias. For position or trend trading, a length of 30–50 bars on daily or weekly charts identifies major momentum cycles lasting weeks to months.
Unlike bounded oscillators such as RSI (0–100) or Stochastics (0–100), the Momentum indicator has no fixed boundaries. This means absolute values are instrument-specific, but zero-crossovers, divergences, and relative extremes are universally meaningful signals that transfer across markets and timeframes.
Pine Script Code Example
The script below calculates the Momentum indicator using ta.mom(close, 10) — measuring the price difference between the current bar and 10 bars ago — and plots the result as a zero-line oscillator. To use it in TradingView, copy the code, open the Pine Script Editor (Alt+P), paste the script, click Add to chart, and the Momentum line will appear in a separate panel below the price chart.
// This source code is subject to the terms of the Mozilla Public License 2.0 at https://mozilla.org/MPL/2.0/
// © Pineify

//@version=6
indicator(title="Momentum", overlay=false, max_labels_count=500)

// Calculate Momentum: difference between current close and close 10 bars ago
p_ind_1 = ta.mom(close, 10) // MOM

// Plot the Momentum line
plot(p_ind_1, "MOM", color.rgb(41, 98, 255, 0), 1)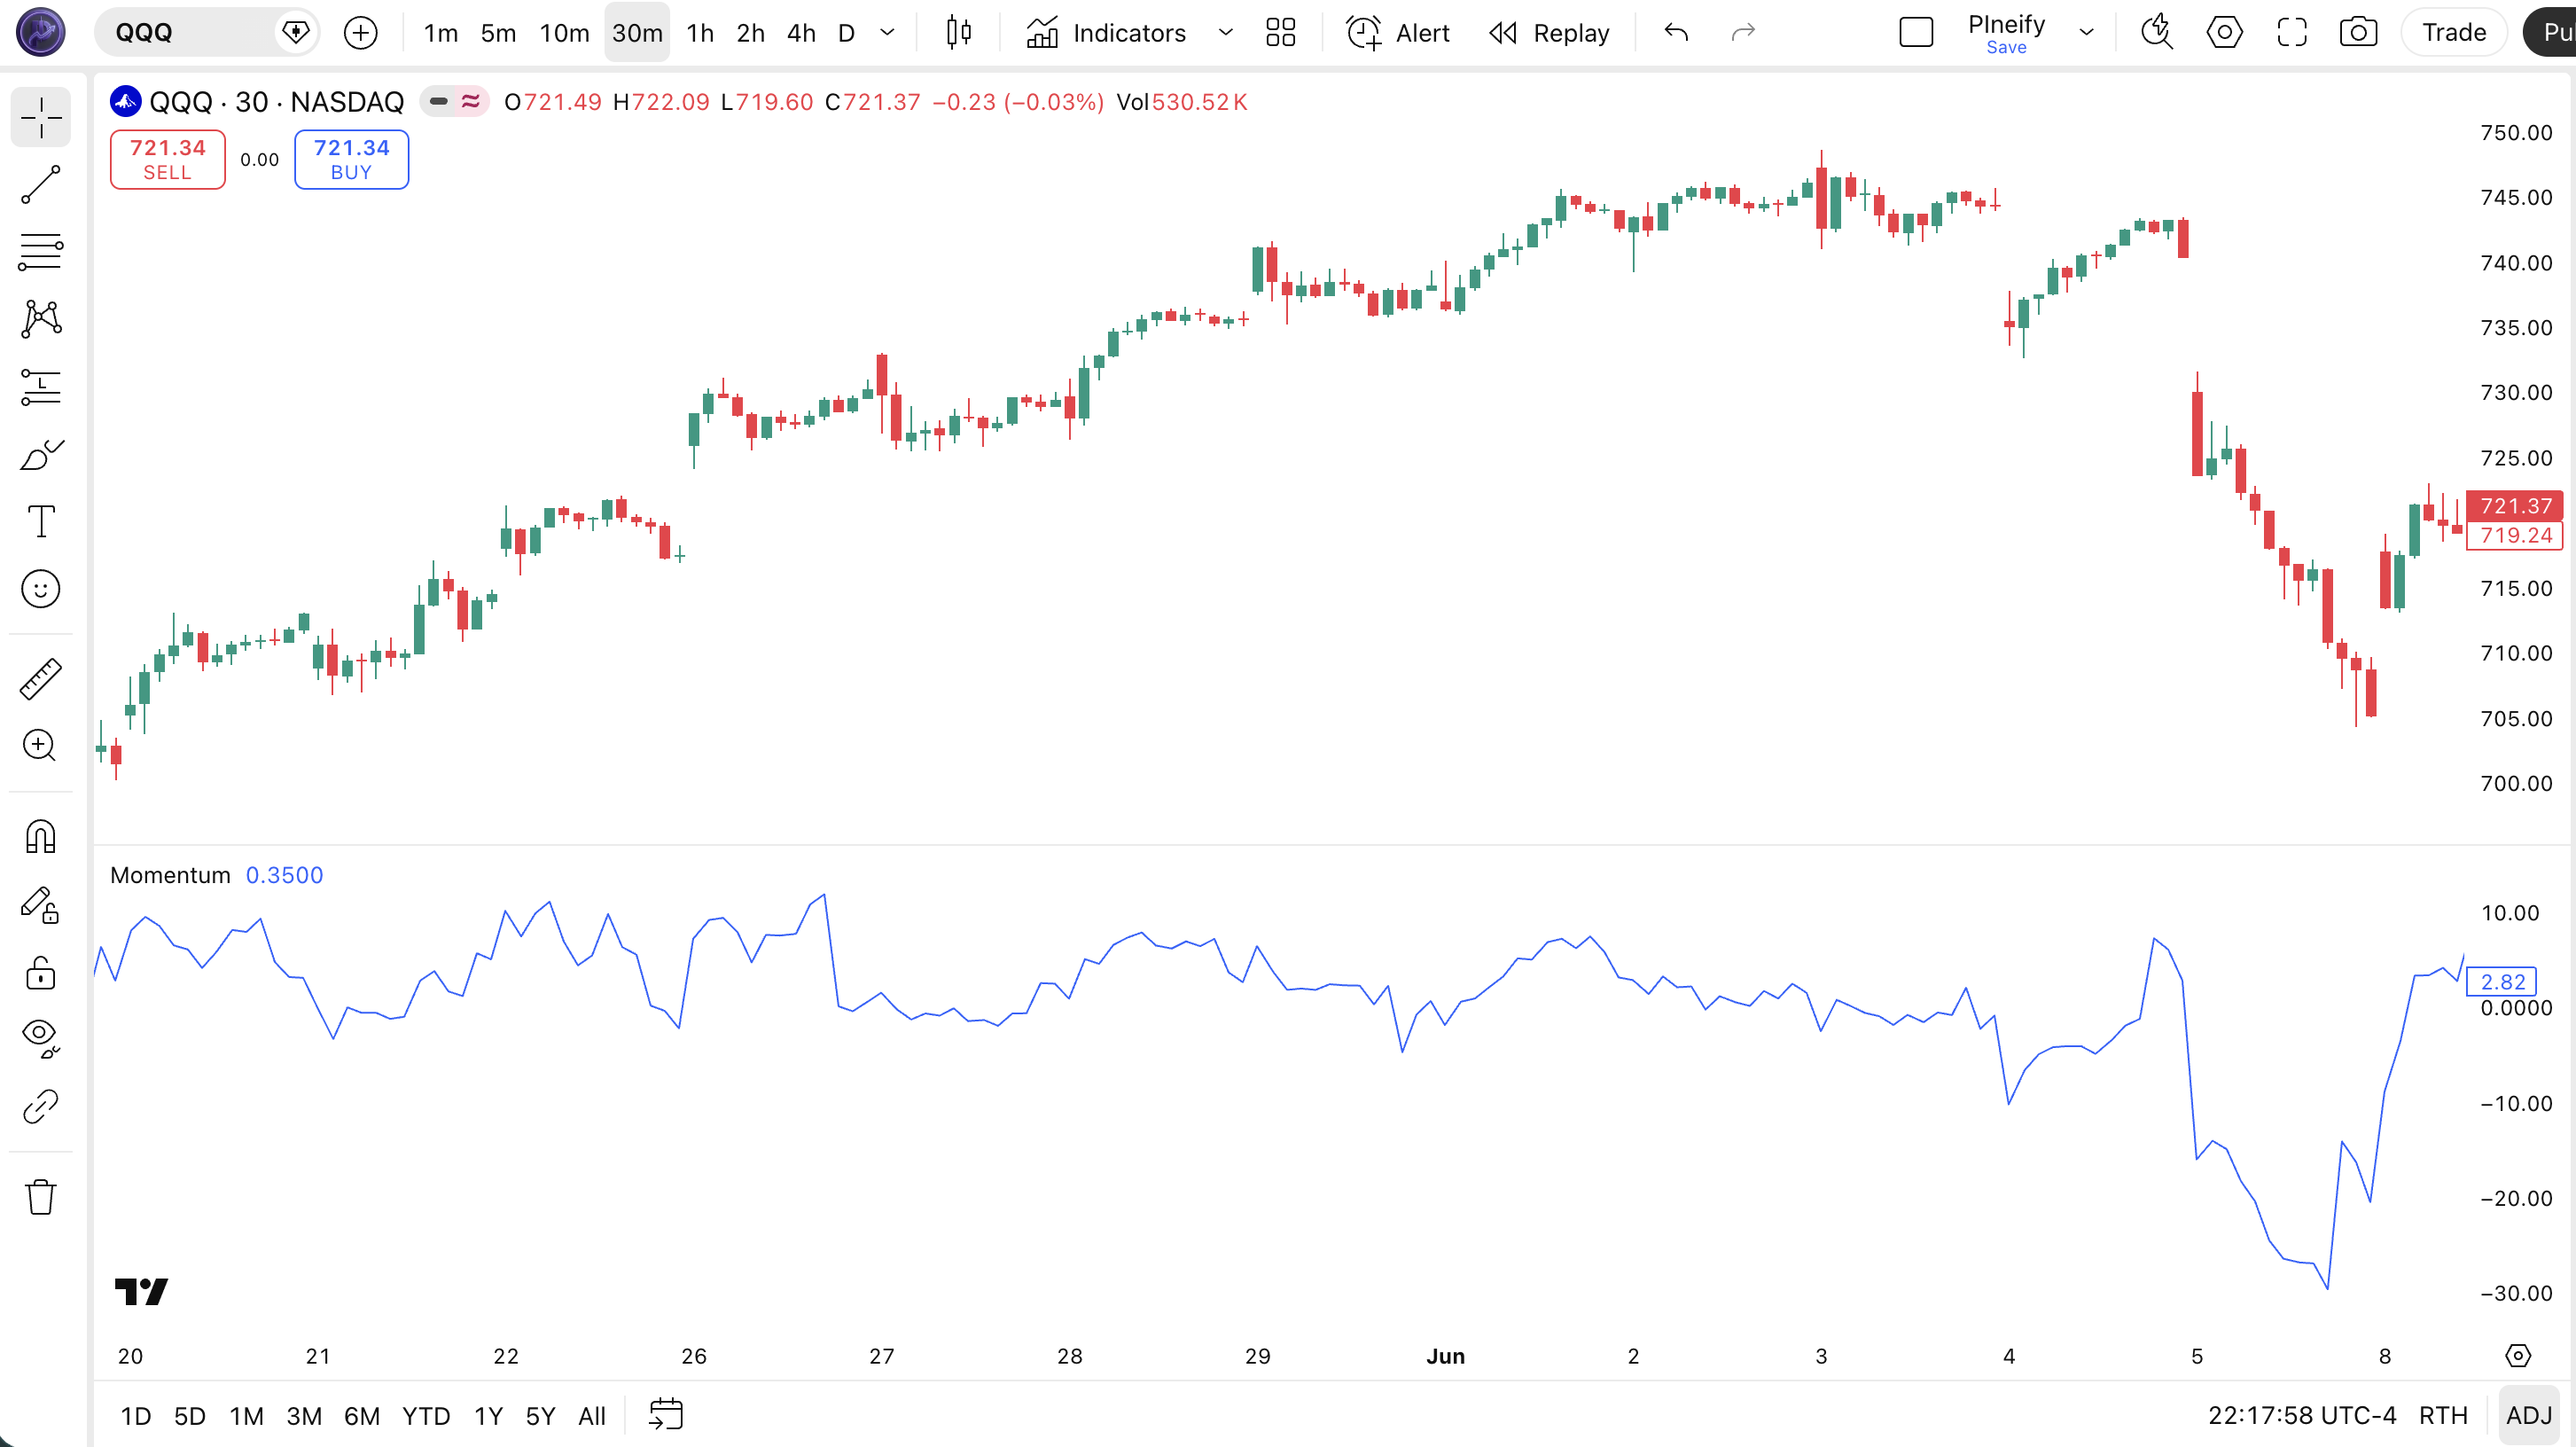
Parameters
| Parameter | Default Value | Description | Recommended Range |
|---|---|---|---|
| source | close | The price series to measure momentum on. Accepts any numeric series: close, open, high, low, or a calculated value. | close (standard), hlc3 (noise-reduced) |
| length | 10 | The lookback period in bars. Determines how far back to compare the current price — smaller values react faster, larger values are smoother. | 5–8 (scalping), 10–20 (swing), 30–50 (trend) |
Tuning Scenarios
- Scalping (1–5 min charts): use length 5–8 to capture fast momentum bursts with tight stops.
- Swing trading (1H / Daily): use length 10–20 for balanced signals with fewer whipsaws.
- Position / trend trading (Daily / Weekly): use length 30–50 to track major multi-week momentum cycles.
Trading Strategies with Momentum
Strategy 1: Momentum Zero-Line Crossover (Trending Markets)
Best environment: trending markets on daily or 4-hour charts. Pair with: 200-bar SMA trend filter.
Entry conditions:
- Price is above its 200-bar SMA (confirming uptrend).
ta.mom(close, 10)crosses above zero from below.- Enter a long position at the close of the crossover bar.
Exit conditions:
ta.mom(close, 10)crosses below zero, or- Price closes below the 200-bar SMA (trend invalidated).
Strategy 2: Momentum Divergence Reversal (Trend Exhaustion)
Best environment: late-stage trends showing signs of exhaustion. Pair with: RSI for confirmation.
Entry conditions (Bullish Reversal):
- Price makes a new lower low over the last 20 bars.
ta.mom(close, 10)makes a higher low (bullish divergence).- RSI (14) is below 40, confirming oversold conditions.
- Enter long at the close of the divergence bar; set stop below the price low.
Exit conditions:
- Momentum crosses below zero again, or
- A 2:1 reward-to-risk target is reached.
Strategy 3: Smoothed Momentum EMA Crossover (Noise-Reduced)
Best environment: volatile or choppy markets. Pair with: volume spike filter to avoid false signals.
Entry conditions:
- Calculate smoothed Momentum:
ta.ema(ta.mom(close, 10), 5). - Smoothed Momentum crosses above zero with volume above its 20-bar average.
- Enter long at the next bar open.
Exit conditions:
- Smoothed Momentum crosses below zero, or
- Trailing stop of 1.5× ATR(14) is hit.
Disclaimer: The strategies above are for educational purposes only. They do not constitute investment advice. Always test any strategy on historical data and use proper risk management before trading with real capital.
How to Generate a Momentum Pine Script in Pineify
- 1
Open Pineify
Navigate to pineify.app and sign in to your account to access the Pine Script generator.
- 2
Click "New Indicator"
From your dashboard, click the New Indicator button to launch the indicator builder with a blank configuration.
- 3
Describe your Momentum setup
Type your requirements in plain English — for example: "Add a Momentum indicator with length 10 on close, plotted as a blue line with a zero reference line."
- 4
Copy the generated Pine Script
Pineify generates a complete Pine Script v6 file. Click Copy to clipboard to grab the full script, ready to paste into TradingView.
- 5
Adjust parameters and add to chart
Paste the script into the TradingView Pine Script Editor, click Add to chart, then open the indicator settings to fine-tune the length and source to match your trading style.
Frequently Asked Questions
Ready to Build Your Momentum Strategy?
Generate a fully customised Momentum Pine Script in seconds. No coding required — just describe what you need.
Start for Free