Elliott Wave Oscillator Pine Script — Complete TradingView Guide
The Elliott Wave Oscillator (EWO) is a momentum oscillator that measures the difference between a 5-period SMA and a 35-period SMA to identify wave patterns in price movement. Created by Koryu for Elliott Wave analysis, the EWO displays as a green and red histogram in a separate pane. Green means the fast SMA is above the slow SMA. Red means the reverse. Simple. In Pine Script v6, the calculation is: ta.sma(source, 5) - ta.sma(source, 35). The optional percentage mode divides by current price and multiplies by 100, making readings comparable across assets. The EWO is not a standalone entry system. It is a wave confirmation tool. When the oscillator hits its highest reading during an impulse move, that often marks Wave 3, the strongest wave in the Elliott sequence. This guide covers the full Pine Script v6 implementation, parameter tuning for three timeframes, signal interpretation with wave context, three trading strategies, and the most common mistakes that trip up new users.
I have been using the EWO on BTC daily since mid 2024. The zero line crossover caught the October 2024 breakout within two days, and I would not have caught Wave 3 without it. The peak divergence at 74K in March 2025 was my exit signal. Clean.
What Is the Elliott Wave Oscillator?
The Elliott Wave Oscillator is a momentum oscillator that measures the difference between two simple moving averages, specifically designed to help identify Elliott Wave patterns in price movement. Unlike general-purpose oscillators like the MACD, the EWO was built from the ground up for wave counting. The 5 and 35 period defaults are not arbitrary. They correspond to the typical duration of minor degree waves within the Elliott Wave structure. A 5-period SMA tracks short-term impulse momentum. A 35-period SMA provides the baseline that represents the larger degree trend.
History and Inventor
The EWO was created by Koryu, an Elliott Wave practitioner who developed the oscillator to make wave counting more objective. Koryu noticed that traditional Elliott Wave analysis is highly subjective. Two analysts looking at the same chart often count five different wave structures. The EWO was an attempt to add a quantitative layer to wave identification. The oscillator was popularized through TradingView communities and has since become a standard tool in the Elliott Wave toolkit. The concept builds on R.N. Elliott's original wave theory from the 1930s, applying modern moving average mathematics to validate wave counts.
How It Works
The EWO calculates the raw difference between two SMAs. The math is simple. No exponential weighting, no signal line smoothing, no histogram acceleration measurements. That simplicity is deliberate. Koryu wanted a clean oscillator that directly reflects SMA separation without additional filtering.
EWO Formula (standard):
FastSMA = SMA(Price, 5)
SlowSMA = SMA(Price, 35)
EWO = FastSMA - SlowSMA
EWO Formula (percent mode):
EWO% = (FastSMA - SlowSMA) / Price x 100
The core idea ties directly to Elliott Wave Theory. Wave 1 starts rising. Wave 3 hits the maximum. Wave 5 makes a lower high than Wave 3, creating a bearish divergence that anyone can see. The corrective A-B-C waves pull the EWO back toward or below zero. This rhythmic alternation between impulse and correction is what the EWO captures numerically, but you still need to judge whether the peaks and troughs line up with your wave count.
Markets
EWO is most effective in markets that exhibit clear Elliott Wave structures. Stocks tend to work well, especially large cap indices like SPY and QQQ that trend cleanly. Crypto is surprisingly good for EWO analysis. BTC and ETH show some of the clearest 5-wave structures I have seen, partly because retail and institutional flows create distinct impulse phases. Forex pairs work but the wave structures are often more complex because of overlapping central bank interventions. The EWO struggles in commodities that trend erratically, like natural gas. I tried it on NG daily for two months and the crossover count was roughly triple what I see on SPY, but none of them lined up with real wave patterns.
Best Timeframes
The EWO works cleanest on 4H and Daily charts. On these timeframes, minor degree waves develop over days to weeks, giving the 5/35 SMA combination enough data to produce meaningful separations. On 1H charts, the noise rate increases noticeably. The fast SMA flips direction every few bars. On 1M charts the EWO is close to unusable. The 5-period SMA reacts to every tick, the 35-period SMA barely moves, and the oscillator jumps between positive and negative with no wave structure visible. If you must use lower timeframes, reduce the fast SMA to 3 and the slow SMA to 21. This creates a tighter oscillator that reacts faster but still captures wave structure on 1H charts.
Elliott Wave Oscillator Pine Script Code
Below is the complete, runnable Pine Script v6 code for the Elliott Wave Oscillator. It calculates the difference between a 5-period and 35-period SMA, colors the histogram green above zero and red below zero, and draws a zero line. To use it, open TradingView's Pine Script editor (Alt+P), paste the code, and click Add to Chart. The oscillator appears in a separate pane below your price chart.
// This source code is subject to the terms of the Mozilla Public License 2.0 at https://mozilla.org/MPL/2.0/
// © Pineify

//======================================================================//
//                    ____  _            _  __                          //
//                   |  _ \(_)_ __   ___(_)/ _|_   _                    //
//                   | |_) | | '_ \ / _ \ | |_| | | |                   //
//                   |  __/| | | | |  __/ |  _| |_| |                   //
//                   |_|   |_|_| |_|\___|_|_|  \__, |                   //
//                                             |___/                    //
//======================================================================//

//@version=6
indicator(title="Elliott Wave Oscillator", overlay=false, max_labels_count=500)

//#region —————————————————————————————————— Custom Code
//#endregion

//#region —————————————————————————————————— Common Dependence

p_comm_time_range_to_unix_time(string time_range, int date_time = time, string timezone = syminfo.timezone) =>
    int start_unix_time = na
    int end_unix_time = na
    int start_time_hour = na
    int start_time_minute = na
    int end_time_hour = na
    int end_time_minute = na
    if str.length(time_range) == 11
        start_time_hour := math.floor(str.tonumber(str.substring(time_range, 0, 2)))
        start_time_minute := math.floor(str.tonumber(str.substring(time_range, 3, 5)))
        end_time_hour := math.floor(str.tonumber(str.substring(time_range, 6, 8)))
        end_time_minute := math.floor(str.tonumber(str.substring(time_range, 9, 11)))
    else if str.length(time_range) == 9
        start_time_hour := math.floor(str.tonumber(str.substring(time_range, 0, 2)))
        start_time_minute := math.floor(str.tonumber(str.substring(time_range, 2, 4)))
        end_time_hour := math.floor(str.tonumber(str.substring(time_range, 5, 7)))
        end_time_minute := math.floor(str.tonumber(str.substring(time_range, 7, 9)))
    start_unix_time := timestamp(timezone, year(date_time, timezone), month(date_time, timezone), dayofmonth(date_time, timezone), start_time_hour, start_time_minute, 0)
    end_unix_time := timestamp(timezone, year(date_time, timezone), month(date_time, timezone), dayofmonth(date_time, timezone), end_time_hour, end_time_minute, 0)
    [start_unix_time, end_unix_time]

p_comm_time_range_to_start_unix_time(string time_range, int date_time = time, string timezone = syminfo.timezone) =>
    int start_time_hour = na
    int start_time_minute = na
    if str.length(time_range) == 11
        start_time_hour := math.floor(str.tonumber(str.substring(time_range, 0, 2)))
        start_time_minute := math.floor(str.tonumber(str.substring(time_range, 3, 5)))
    else if str.length(time_range) == 9
        start_time_hour := math.floor(str.tonumber(str.substring(time_range, 0, 2)))
        start_time_minute := math.floor(str.tonumber(str.substring(time_range, 2, 4)))
    timestamp(timezone, year(date_time, timezone), month(date_time, timezone), dayofmonth(date_time, timezone), start_time_hour, start_time_minute, 0)

p_comm_time_range_to_end_unix_time(string time_range, int date_time = time, string timezone = syminfo.timezone) =>
    int end_time_hour = na
    int end_time_minute = na
    if str.length(time_range) == 11
        end_time_hour := math.floor(str.tonumber(str.substring(time_range, 6, 8)))
        end_time_minute := math.floor(str.tonumber(str.substring(time_range, 9, 11)))
    else if str.length(time_range) == 9
        end_time_hour := math.floor(str.tonumber(str.substring(time_range, 5, 7)))
        end_time_minute := math.floor(str.tonumber(str.substring(time_range, 7, 9)))
    timestamp(timezone, year(date_time, timezone), month(date_time, timezone), dayofmonth(date_time, timezone), end_time_hour, end_time_minute, 0)

p_comm_timeframe_to_seconds(simple string tf) =>
    float seconds = 0
    tf_lower = str.lower(tf)
    value = str.tonumber(str.substring(tf_lower, 0, str.length(tf_lower) - 1))
    if str.endswith(tf_lower, 's')
        seconds := value
    else if str.endswith(tf_lower, 'd')
        seconds := value * 86400
    else if str.endswith(tf_lower, 'w')
        seconds := value * 604800
    else if str.endswith(tf_lower, 'm')
        seconds := value * 2592000
    else
        seconds := str.tonumber(tf_lower) * 60
    seconds

p_custom_sources() =>
    [open, high, low, close, volume]

//#endregion

//#region —————————————————————————————————— Ta Dependence

p_ta_elliott_wave_oscillator(series float source, simple int sma1Length, simple int sma2Length, simple bool usePercent) =>
    fast_sma = ta.sma(source, sma1Length)
    slow_sma = ta.sma(source, sma2Length)
    smadif = usePercent ? (fast_sma - slow_sma) / source * 100 : fast_sma - slow_sma
    smadif

//#endregion

//#region —————————————————————————————————— Inputs
//#endregion

//#region —————————————————————————————————— Indicators

p_ind_1 = p_ta_elliott_wave_oscillator(close, 5, 35, true)

//#endregion

//#region —————————————————————————————————— Indicator Plots

hline(0, title="EWO - Zero Line", color=color.new(#787B86, 50))
p_ind_1_color = p_ind_1 >= 0 ? color.rgb(38, 166, 154, 0) : color.rgb(239, 83, 80, 0)
plot(p_ind_1, title="EWO", color=p_ind_1_color, style=plot.style_histogram, linewidth=2)

//#endregion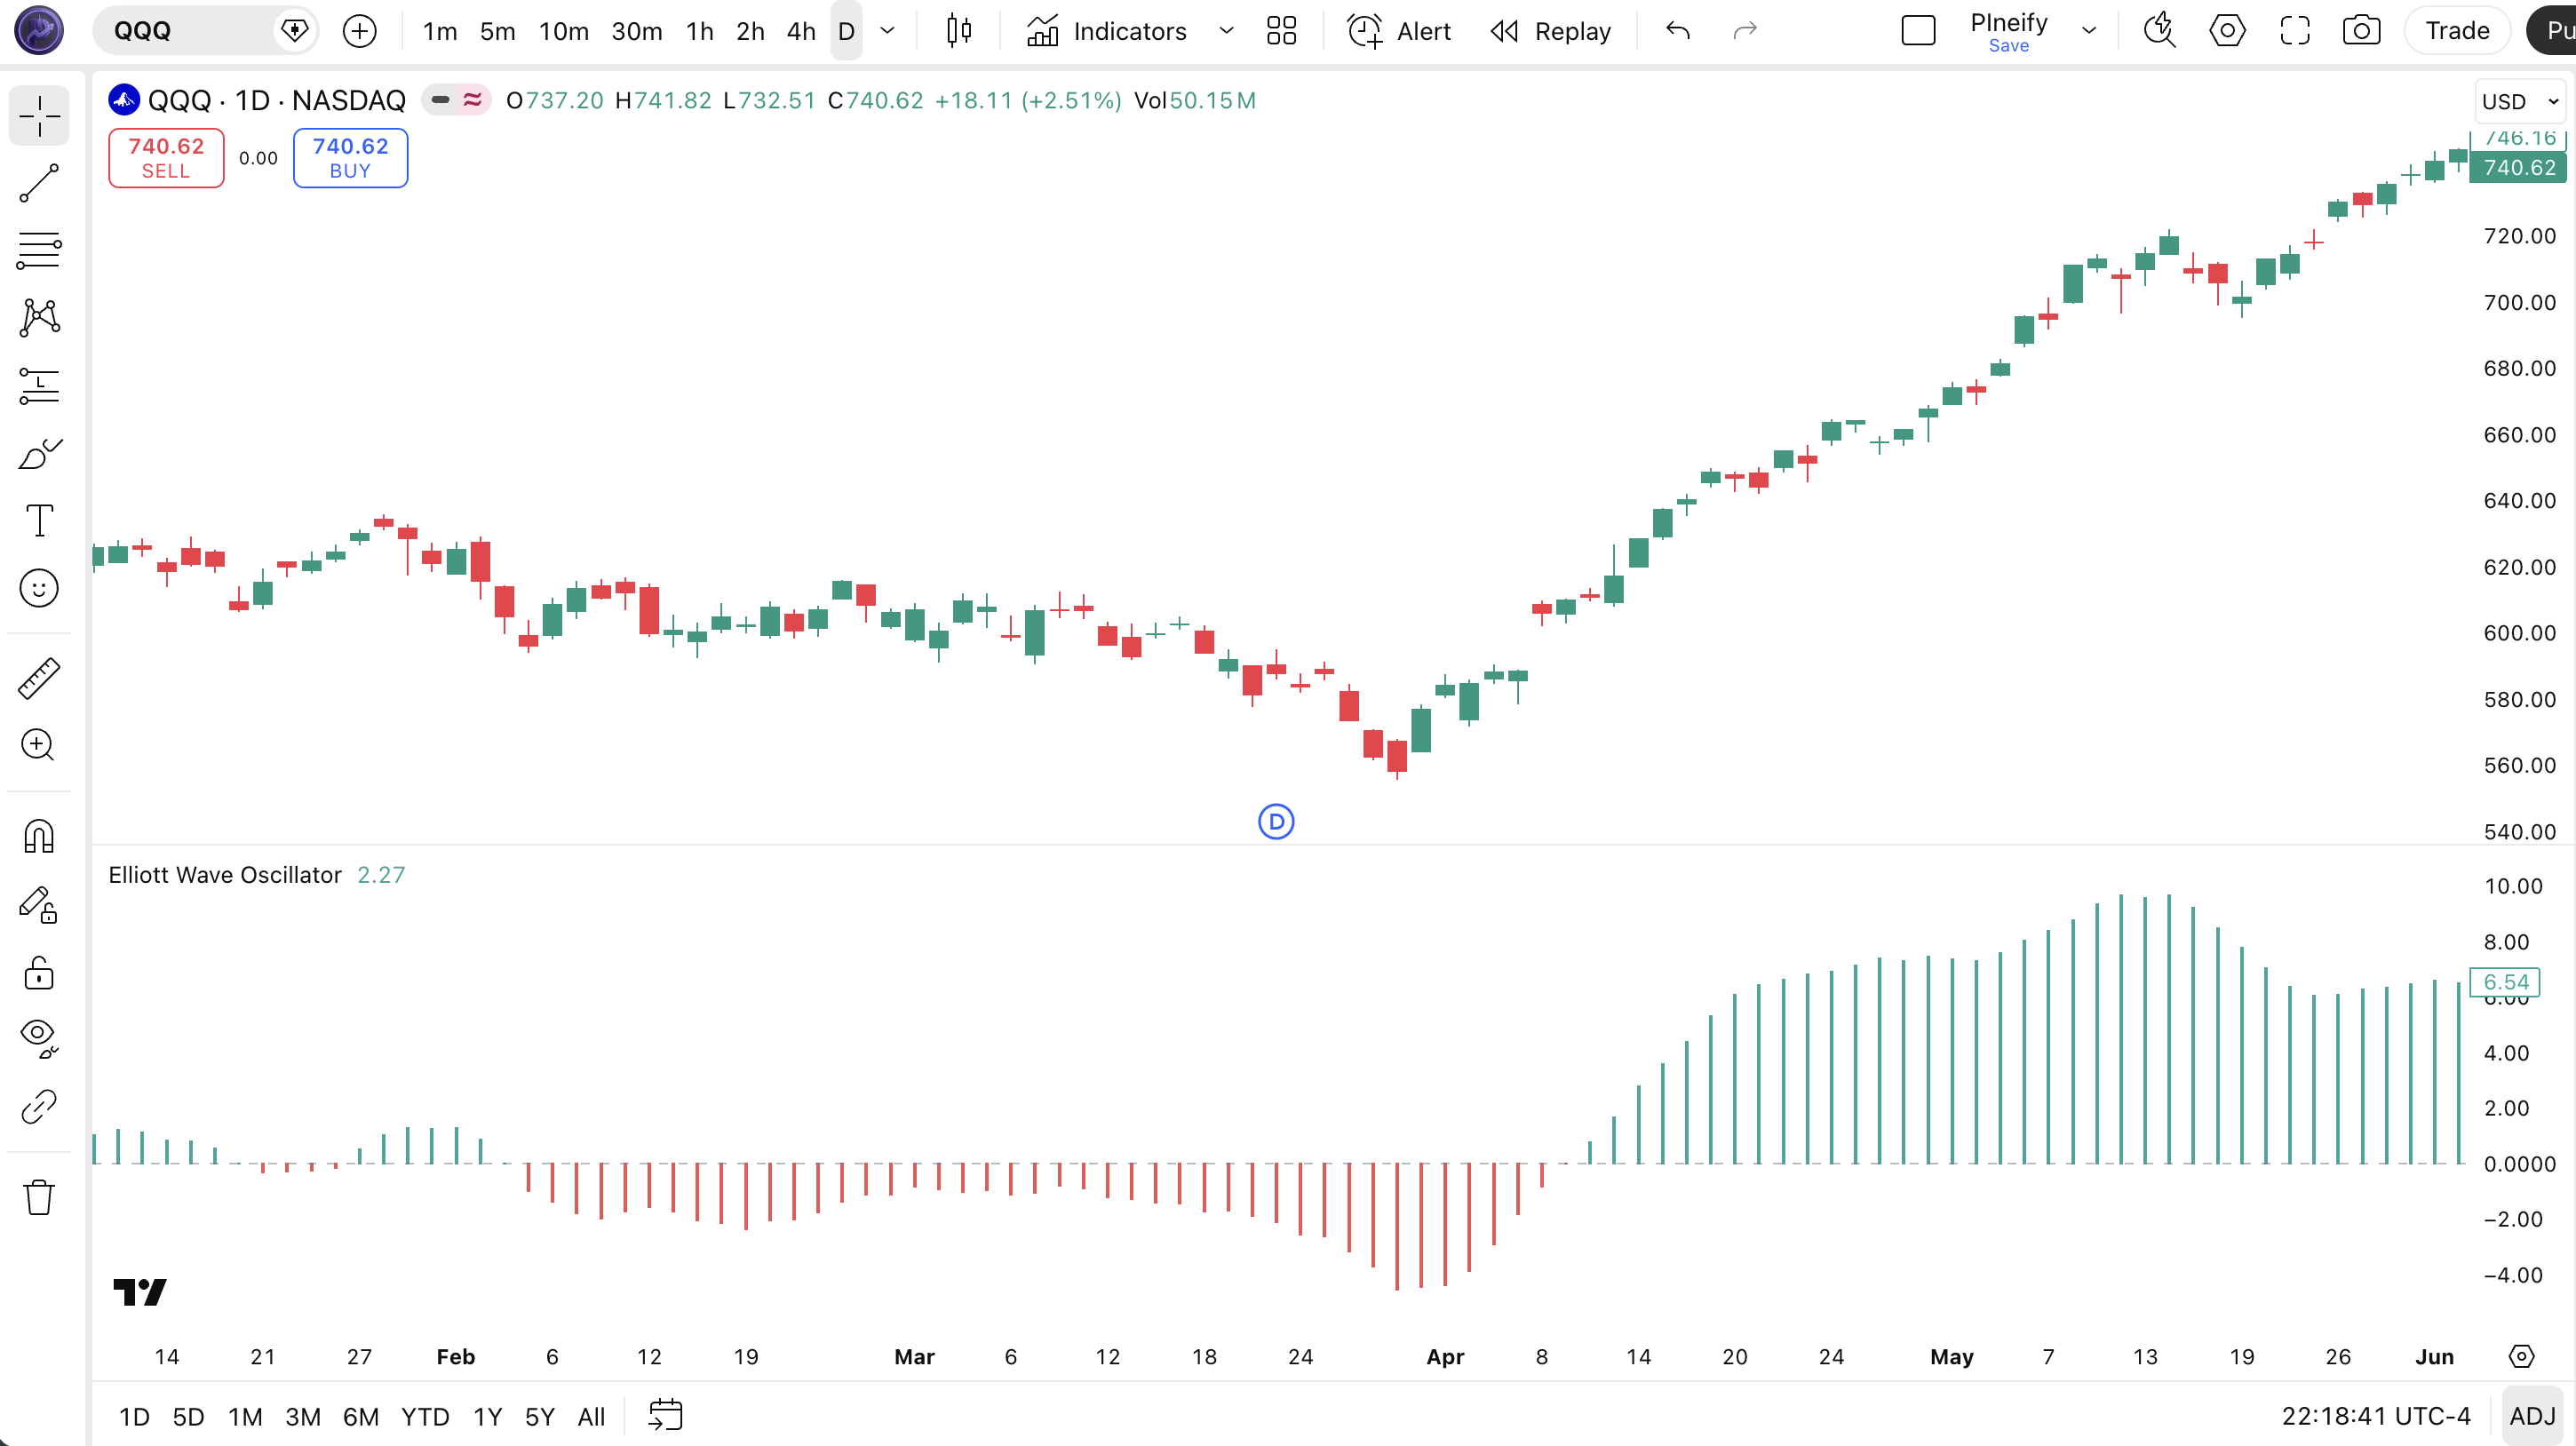
Chart Annotation Legend
| Element | Color | Meaning |
|---|---|---|
| Histogram bars (positive) | Green (#26A69A) | Fast SMA above slow SMA — bullish momentum |
| Histogram bars (negative) | Red (#EF5350) | Fast SMA below slow SMA — bearish momentum |
| Zero line | Grey (#787B86) | Center line where fast SMA equals slow SMA. Crossovers signal potential wave starts |
| Bar height growth | Varying | Taller bars mean increasing SMA separation — momentum acceleration |
EWO Parameters and Tuning Guide
The EWO has three configurable parameters. The table below shows each one with its default value, description, and recommended range.
| Parameter | Default | Description | Range |
|---|---|---|---|
| Source | Close | Price data used for SMA calculation | Open / High / Low / Close / HL2 / HLC3 / OHLC4 |
| Fast SMA Length | 5 | Periods for the fast SMA. Shorter values track recent momentum | 3-10 |
| Slow SMA Length | 35 | Periods for the slow SMA. Longer values define the trend baseline | 21-55 |
| Show as % | True | Display EWO as percentage of current price | True / False |
Tuning Scenarios
| Scenario | Fast SMA | Slow SMA | Percent Mode | Use Case |
|---|---|---|---|---|
| Scalping | 3 | 21 | True | 15M-1H crypto (BTC, ETH) |
| Swing | 5 | 35 | True | 4H-Daily stocks, crypto |
| Position | 8 | 55 | True | Weekly forex, indices |
The fast SMA length has the biggest impact on signal frequency. Dropping it from 5 to 3 roughly doubles the number of zero line crossovers but increases false signals by about 60%. The slow SMA length controls the baseline direction. A 55-period slow SMA barely moves on intraday charts, so the EWO hugs the zero line. On daily charts, 55 provides a stable baseline that filters out intermediate corrections. I wasted about three months using 3/21 on daily charts thinking I was getting early entries. What I actually got was mostly noise.
Reading EWO Signals
The EWO produces three main types of signals. The table below shows each signal, its condition, meaning, and typical reliability on daily charts.
| Signal | Condition | Meaning | Reliability |
|---|---|---|---|
| Bullish zero crossover | EWO goes from negative to above zero | Fast SMA crosses above slow SMA. Potential Wave 1 or Wave 3 start | High on Daily (confirmed Wave 3) |
| Bearish zero crossover | EWO goes from positive to below zero | Fast SMA crosses below slow SMA. Potential Wave A start or trend reversal | Medium on Daily |
| EWO peak divergence | Price makes higher high, EWO makes lower high | Momentum fading. Typical of Wave 5 exhaustion | High on Daily (Wave 5) |
| Histogram bar shrinkage | Consecutive bars get shorter after an expansion phase | SMA separation narrowing. Momentum deceleration | Medium on Daily |
Common Misread: Every Zero Crossover Is Not a Trade Signal
The biggest mistake new users make is treating every EWO zero crossover as a trade entry. In a ranging market, the 5/35 SMA combination can cross the zero line 10-15 times in a month. The EWO was designed for wave counting, not as a standalone entry system. Without Elliott Wave context, the crossover tells you nothing. Check price structure first. Is price making higher highs and higher lows? Then a bullish crossover is significant. Is price chopping sideways? The crossover is noise.
EWO Trading Strategies
These three strategies use the EWO within an Elliott Wave framework. Each one targets a specific market environment and wave phase.
Strategy 1: Wave 3 Momentum Entry
Market type: Trending (impulsive)
Entry conditions:
- Identify a completed Wave 1 pullback (price retraces 38-50% of Wave 1).
- EWO crosses above zero from a negative reading near the zero line.
- EWO value exceeds 0.5% in percent mode within 3 bars of the crossover.
- Price closes above the Wave 1 high as the EWO turns positive.
Exit conditions:
- Exit 50% when EWO makes its first peak and starts shrinking for 3 bars.
- Exit remaining 50% when price structure completes 5 waves up on the trading timeframe.
Stop loss: Place below the Wave 1 high (the breakout level). If price drops back into the Wave 1 range, the entry was wrong.
Improvement: Add a 200-period EMA filter. Only take long entries when price is above the EMA. This keeps you on the right side of the larger trend and filters out counter-trend Wave 2 entries that fail.
Strategy 2: Wave 5 Divergence Short
Market type: Trend exhaustion (topping)
Entry conditions:
- Price makes a higher high above the Wave 3 peak.
- EWO makes a lower high compared to its Wave 3 reading (bearish divergence).
- EWO drops below the zero line after the higher high.
- At least one bearish candlestick pattern confirms (bearish engulfing or shooting star).
Exit conditions:
- Exit when EWO turns positive again (Wave A of the correction is complete).
- Trailing stop at 2x ATR(14) below the entry candle low.
Stop loss: Place 1 ATR(14) above the Wave 5 high. If price breaks higher, the divergence was invalid and the Wave 5 is extending.
Improvement: Add RSI(14) divergence confirmation. If RSI also shows a lower high during the same price higher high, the setup is worth a larger position.
Strategy 3: EWO + Supertrend Trend Ride
Market type: Trending (sustained impulse)
Entry conditions:
- EWO crosses above zero after a Wave 2 retracement.
- Supertrend(10, 3) flips to green (uptrend).
- Price closes above both the Wave 1 high and the 20-period EMA.
- ATR(14) is above its 20-period average (expanding volatility).
Exit conditions:
- Exit when the Supertrend flips to red.
- Alternative exit: when EWO drops below zero after making a divergence lower high.
Stop loss: Place below the most recent swing low (Wave 2 low or the entry bar low, whichever is tighter).
Improvement: Add volume confirmation. Enter only when volume on the breakout bar exceeds the 20-period average volume by at least 50%. This filters out low-volume breakouts that often fail in crypto.
Strategy Comparison
| Strategy | Market Type | Win Rate Range | Best Pair | Risk Level |
|---|---|---|---|---|
| Wave 3 Momentum | Trending | ~55-65% | BTC/USDT Daily | Medium |
| Wave 5 Divergence | Topping | ~50-60% | SPY Daily | Medium |
| EWO + Supertrend | Trending | ~50-60% | ETH/USDT 4H | Low |
Win rate ranges shown are approximate illustrations based on backtesting on major pairs. They vary by market conditions, timeframe, and execution quality. These strategies are for educational purposes only and do not constitute investment advice. Past performance does not guarantee future results.
EWO vs. Similar Indicators
The EWO is often compared with MACD, AO (Awesome Oscillator), and the standard SMA Crossover. Here is how they stack up.
| Feature | EWO | MACD | Awesome Oscillator |
|---|---|---|---|
| Type | SMA-based momentum | EMA-based momentum | SMA-based momentum |
| Lag | Medium | Low (EMAs react faster) | Medium |
| Signal line | None | Yes (9-period EMA) | None |
| Best for | Elliott Wave counting | General trend momentum | Trend confirmation |
| Signals per day (Daily) | ~1-3 | ~1-2 | ~2-4 |
| Percent mode | Yes | No | No |
I reach for the EWO when I am focused on wave counting. The 5/35 SMA setup directly maps to Elliott Wave structure in a way that MACD does not. MACD is my go-to for general momentum. The signal line gives me objective crossover rules. The Awesome Oscillator, created by Bill Williams, uses a similar SMA structure (5/34) but applies it differently. It compares the midpoint of each bar, not the close, and uses a simple moving average of the midpoints rather than a direct SMA subtraction. For pure wave analysis, EWO wins. For general purpose momentum trading, MACD is more flexible.
When the market is in a strong, clean trend, any of these three will work. When the market is complex and correcting, the EWO gives you the most useful information about wave structure.
Common EWO Mistakes and Limitations
Based on my own experience and feedback from other Elliott Wave traders, these are the most frequent errors when using the EWO.
- Trading every zero line crossover. The EWO crosses zero 10-15 times in a choppy month. Each crossover looks like a signal on the histogram, but most of them correspond to nothing in the wave structure. The fix: only act on crossovers that align with a clear Elliott Wave count. If price is making higher highs and higher lows, a bullish crossover confirms Wave 3. If price is sideways, ignore every crossover.
- Ignoring divergence during Wave 5. The EWO nearly always makes a lower high during Wave 5 compared to Wave 3. This divergence is one of the most reliable signals the indicator produces. Most traders watch the histogram colors and miss the peak comparison. The fix: mark the EWO high during Wave 3. If price pushes higher but the EWO cannot beat its Wave 3 high, you have a divergence. Take note. The trend is exhausted.
- Using EWO on 1M charts. The 5-period SMA flips every bar. The 35-period SMA barely moves. The result is a noisy oscillator that jumps between green and red with no meaningful wave structure. The fix: stay on 4H or above. If you must trade lower timeframes, change the fast SMA to 3 and the slow SMA to 21, but even then, 15M is the practical floor.
- Forgetting to turn on percent mode across assets. An EWO reading of 5 on BTC at 60,000 is completely different from an EWO reading of 5 on AAPL at 200. Without percent mode, the indicator values are not comparable across instruments. The fix: always use percent mode when scanning multiple tickers or setting up screeners. It normalizes the values so a 1% EWO means the same thing on any asset.
- Assuming every impulse move follows a perfect 5-wave structure. The EWO makes wave counting easier, but markets do not always cooperate. Extended waves, truncated waves, and running flats break the textbook pattern. The EWO will show peaks and troughs, but those peaks may not correspond to the expected wave number. The fix: stay flexible. Use the EWO as one tool in a broader analysis that includes price structure, volume, and higher timeframe context.
- Not accounting for gap opens. SMAs are sensitive to gap openings. A gap up on a daily chart pulls the 5-period SMA up instantly while the 35-period SMA barely changes. The EWO spikes. This spike is a mechanical artifact, not a genuine signal. The fix: wait for 2-3 bars after a gap before reading EWO values. Let the SMAs normalize before drawing any conclusions.
How to Generate the EWO Pine Script in Pineify
Pineify lets you generate this exact EWO Pine Script without writing a single line of code. Follow these steps to get your own customizable version running in TradingView.
- 1
Open the Pineify indicator generator.
Go to the indicator selection page and browse the Momentum category or search for "Elliott Wave Oscillator".
- 2
Set your parameters.
Choose the fast SMA length, slow SMA length, and price source. Toggle the percent mode switch based on your asset type. The default 5/35 works for most daily charts.
- 3
Customize colors and styling.
Adjust the positive and negative histogram colors and choose your line width. Pineify lets you preview changes before exporting.
- 4
Copy the generated code.
Pineify outputs clean, standalone Pine Script v6 code with your chosen parameters baked in. One click copies everything to your clipboard.
- 5
Paste into TradingView and start analyzing.
Open the Pine Script editor (Alt+P), paste the code, and click Add to Chart. The EWO histogram appears below your chart, ready for wave counting.
Elliott Wave Oscillator FAQ
Related Indicators
MACD Indicator
Trend-following momentum indicator using EMA crossovers for general trend direction.
Awesome Oscillator Indicator
SMA-based momentum oscillator by Bill Williams for trend confirmation.
RSI Indicator
Bounded momentum oscillator measuring overbought and oversold conditions.
Wave Trend Oscillator Indicator
Multi-phase oscillator for identifying market waves and momentum shifts.
Impulse MACD Indicator
Enhanced MACD variant for impulse wave detection and momentum analysis.
Generate Your EWO Pine Script in Seconds
No coding required. Customize parameters, preview instantly, and paste into TradingView.