Williams %R Pine Script — Complete TradingView Guide
The Williams %R Pine Script indicator is a momentum oscillator that measures where the current closing price sits within the highest high and lowest low over a lookback period. Developed by Larry Williams in 1973, Williams %R oscillates between −100 and 0, with readings above −20 signaling overbought conditions and readings below −80 signaling oversold conditions. In Pine Script v6, the indicator is implemented with the built-in function ta.wpr(14). Traders apply Williams %R across stocks, crypto, forex, and futures to time overbought and oversold reversals, identify momentum divergence, and confirm trend entries. The default 14-period setting is the universal standard across all platforms. This guide covers the complete Williams %R formula, parameter tuning, three named trading strategies, and step-by-step instructions for generating the code in Pineify.
What Is Williams %R?
The Williams %R is a momentum oscillator that measures the relationship between the closing price and the highest high over a lookback period, used to identify overbought and oversold market conditions. Unlike RSI, which compares gains to losses, Williams %R directly measures where price closes relative to its recent price range.
History and Origin
Williams %R was developed by Larry Williams in 1973 and published in his book How I Made One Million Dollars Last Year Trading Commodities. Williams designed the indicator to answer a simple question: is today's close near the top or the bottom of the recent price range? The indicator gained widespread adoption because of its simplicity and its direct relationship to the Stochastic Oscillator — Williams %R is mathematically equivalent to the inverse of the Fast Stochastic %K.
Core Formula
The Williams %R formula is:
Williams %R = (Highest High − Close) / (Highest High − Lowest Low) × −100
Where:
- Highest High = the highest high over the lookback period (default: 14 bars)
- Lowest Low = the lowest low over the same lookback period
- Close = the current bar's closing price
When the closing price equals the highest high, Williams %R = 0 (the maximum, indicating overbought). When the closing price equals the lowest low, Williams %R = −100 (the minimum, indicating oversold). In Pine Script v6, the formula is implemented as ta.wpr(length), which accepts a single integer period parameter.
Reference Levels
Three key horizontal reference levels define Williams %R interpretation:
- −20 (Overbought threshold): Price is closing near the top 20% of its recent range. Potential exhaustion in uptrends.
- −50 (Midpoint): Price is at the center of its recent range. Neutral momentum.
- −80 (Oversold threshold): Price is closing near the bottom 20% of its recent range. Potential exhaustion in downtrends.
Applicable Markets and Timeframes
Williams %R is applicable to all asset classes: stocks, crypto, forex, and futures. It performs best in markets with clear cyclical price swings. Recommended timeframes:
- Scalping (1–5 minute): Williams %R length 5–10, use for fast overbought/oversold signals in ranging conditions
- Day trading (15 minute–1 hour): Williams %R length 10–14, the standard intraday setting
- Swing trading (4 hour–Daily): Williams %R length 14, the original Larry Williams default and most widely cited setting
- Position trading (Weekly): Williams %R length 20–28, for filtering major market cycle turning points
The daily chart with the default 14-period setting is the most frequently referenced benchmark in trading literature, backtesting studies, and professional platform documentation.
Williams %R Pine Script Code Example
The code below is a complete, runnable Pine Script v6 Williams %R indicator generated by Pineify. It uses the built-in ta.wpr(14) function with the standard −20/−50/−80 reference levels and a purple fill band between the overbought and oversold zones. To add it to TradingView, open the Pine Script Editor (Alt+P), paste the entire code, click Add to chart, and the Williams %R oscillator will appear in a separate pane below your price chart.
// This source code is subject to the terms of the Mozilla Public License 2.0 at https://mozilla.org/MPL/2.0/
// © Pineify

//@version=6
indicator(title="Williams %R", overlay=false, max_labels_count=500)

// Williams %R calculation
// Formula: (Highest High - Close) / (Highest High - Lowest Low) * -100
p_ind_1 = ta.wpr(14) // WPR

// Reference levels
p_ind_1_upper = hline(-20, title="WPR - Upper Band", color=#787B86)
hline(-50, title="WPR - Middle Level", linestyle=hline.style_dotted, color=#787B86)
p_ind_1_lower = hline(-80, title="WPR - Lower Band", color=#787B86)
fill(p_ind_1_upper, p_ind_1_lower, title="WPR - Background", color=color.rgb(126, 87, 194, 90))
plot(p_ind_1, title="WPR", color=color.rgb(126, 87, 194, 0), linewidth=1)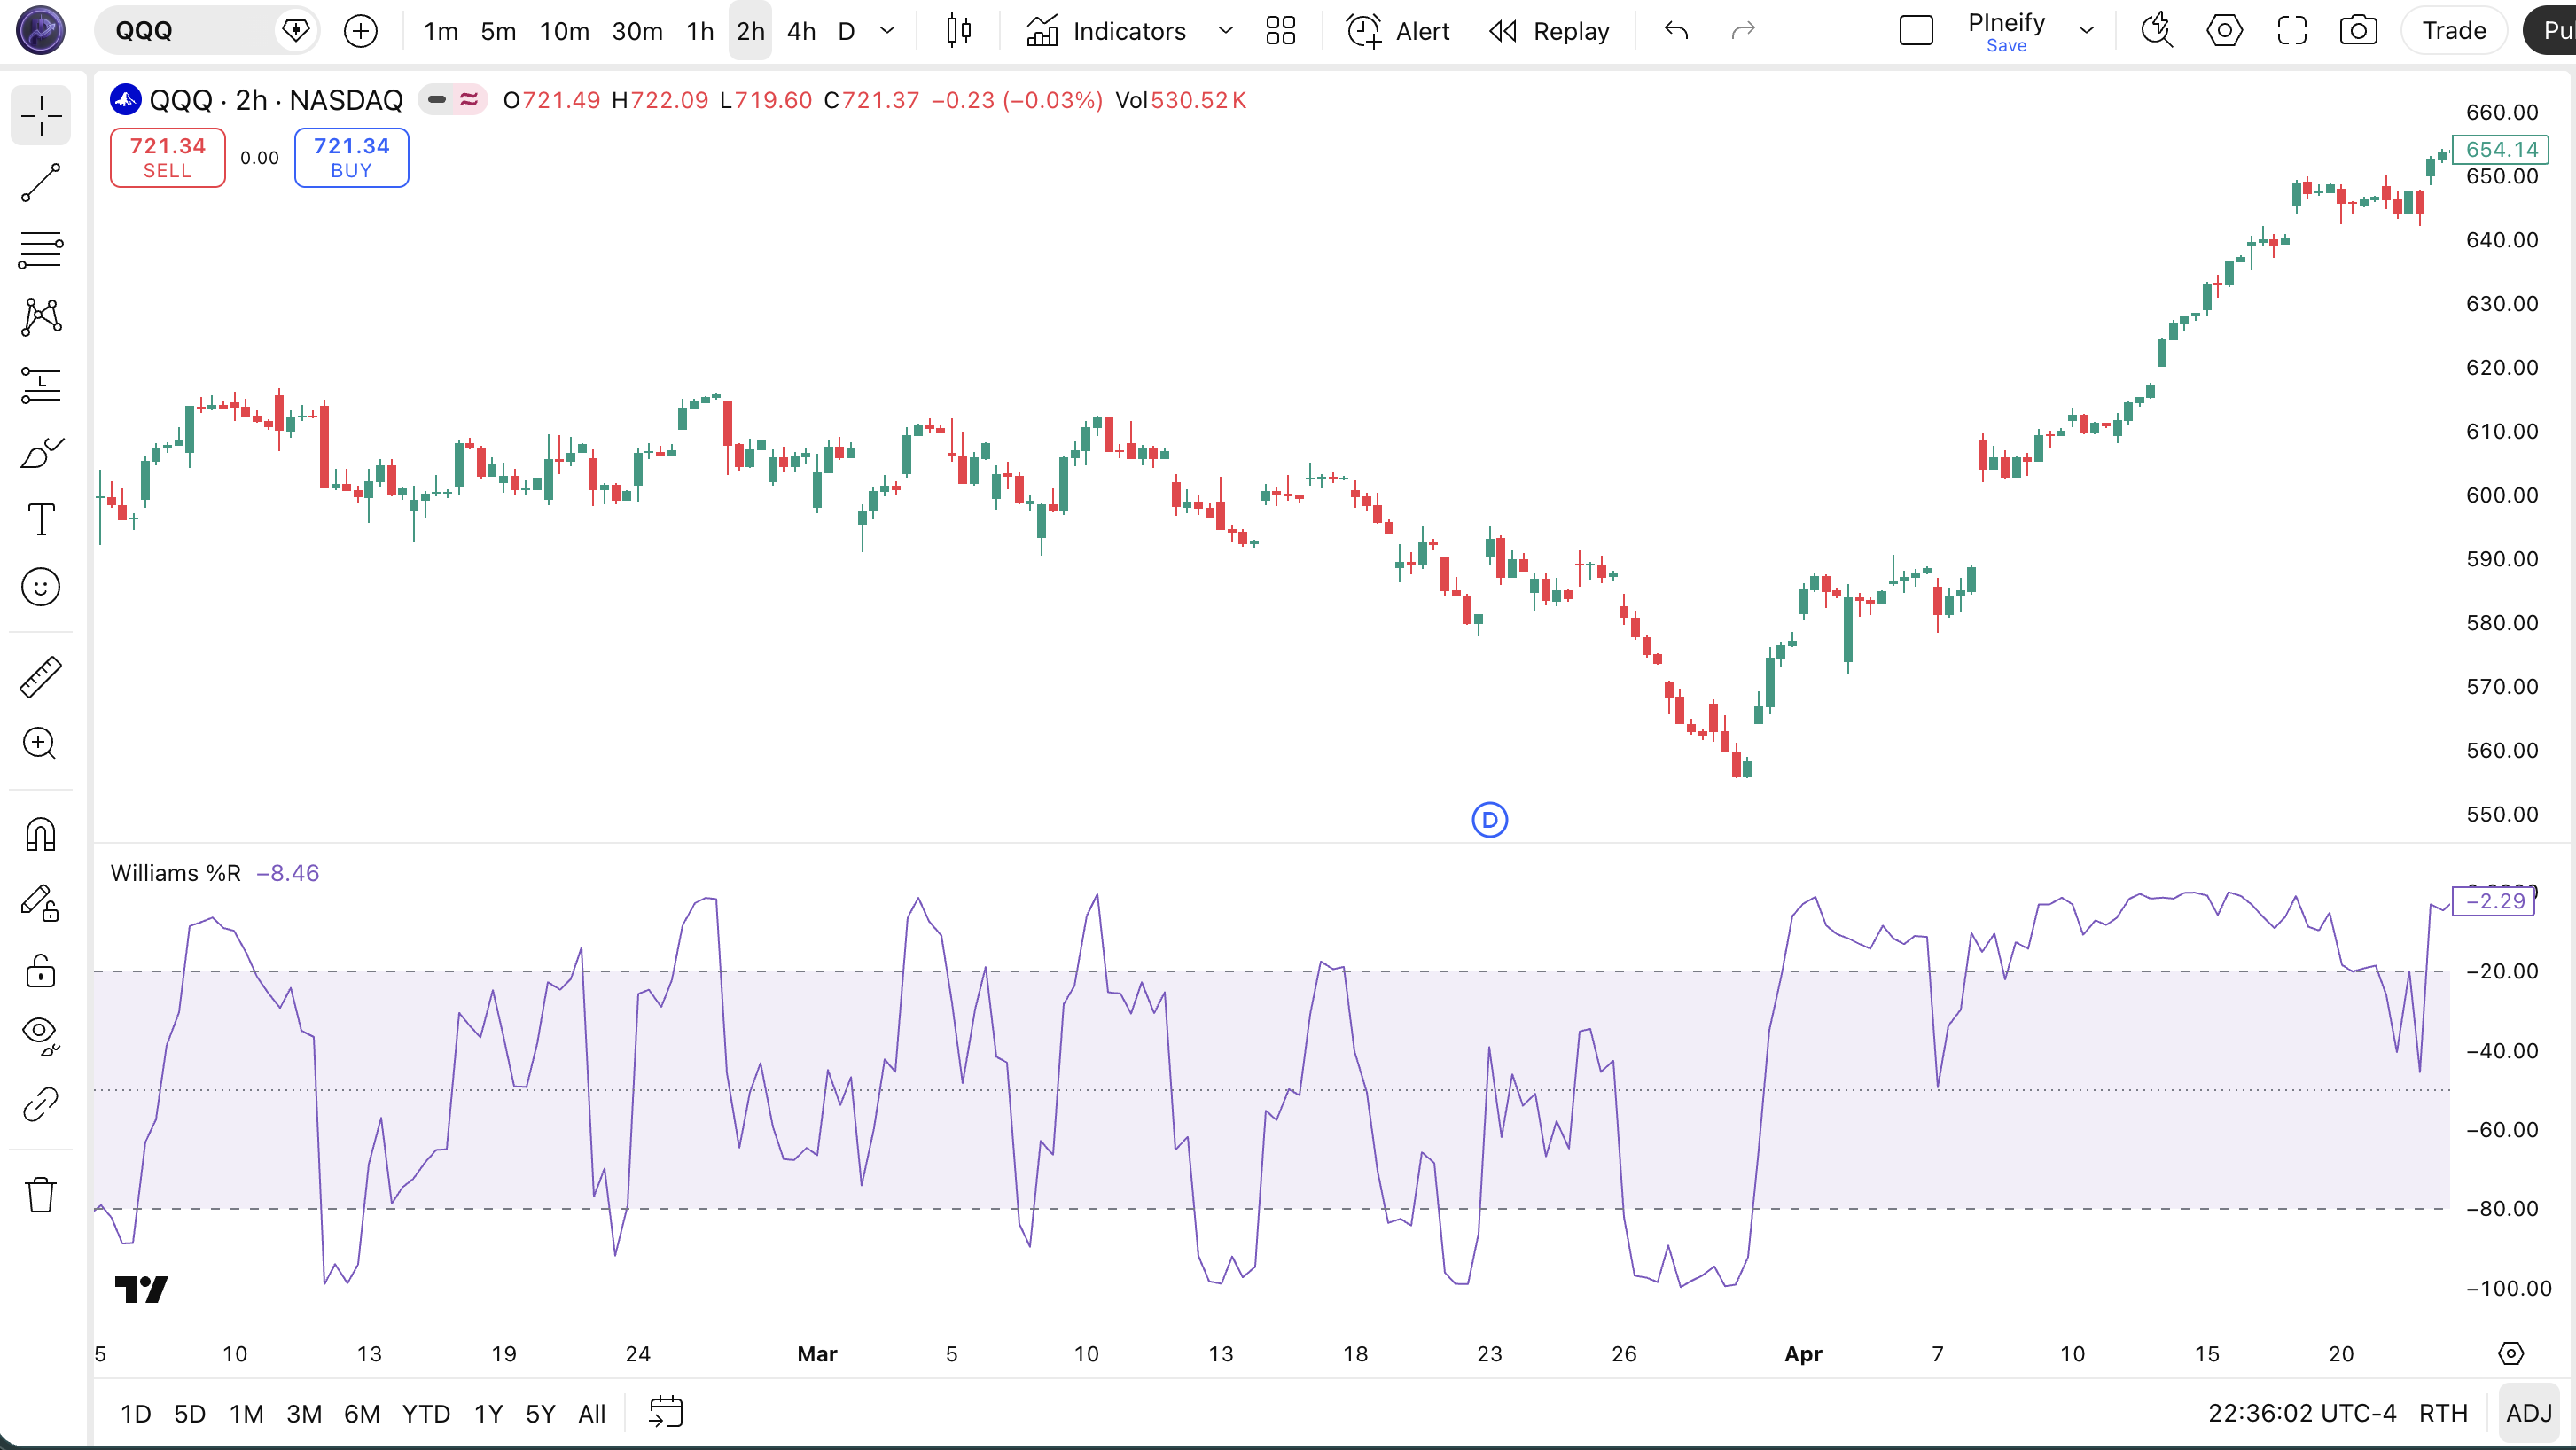
Williams %R Parameters
Williams %R has one primary configurable parameter. The table below lists each parameter, its default value, what it controls, and the recommended range for different trading styles.
| Parameter | Default Value | Description | Recommended Range |
|---|---|---|---|
| length | 14 | Number of bars used to calculate the highest high and lowest low for the %R formula | 5–28 |
| overbought | −20 | Horizontal reference line marking the overbought zone (price near top of recent range) | −10 to −25 |
| oversold | −80 | Horizontal reference line marking the oversold zone (price near bottom of recent range) | −75 to −90 |
| midline | −50 | Dotted midpoint reference line; crossing above/below signals momentum bias shift | Fixed at −50 |
Tuning Scenarios
- Scalping (1–5 min charts): Use length 5–10 for fast overbought/oversold signals; set overbought at −15 and oversold at −85 to reduce false signals in noisy conditions
- Swing trading (Daily chart): Use the default length 14 with −20/−80 thresholds — the most validated setting across professional and retail trading platforms
- Position trading (Weekly chart): Use length 20–28 for major market cycle turning points; standard −20/−80 thresholds remain appropriate
Williams %R Trading Strategies
Strategy 1: Williams %R Failure Swing Reversal
Best for: Ranging markets | Pairs with: EMA trend filter
The failure swing is Larry Williams' original entry method: wait for the indicator to exit the extreme zone, confirming that momentum has reversed direction before entering.
- Calculate Williams %R with default length 14 on the daily chart.
- Bullish setup: wait for Williams %R to drop below −80 (oversold), then cross back above −80.
- Confirm the setup with a 50-period EMA: only take bullish setups when price is above the 50 EMA to avoid counter-trend longs.
- Enter long on the bar that closes after Williams %R crosses back above −80.
- Stop-loss: below the swing low that formed while Williams %R was in the oversold zone.
- Exit when Williams %R rises above −20 (overbought) and crosses back below −20, signaling momentum exhaustion.
Strategy 2: Williams %R Midline Momentum Cross
Best for: Trending markets | Pairs with: MACD
The midline at −50 acts as a momentum dividing line: crossing above −50 signals bullish momentum bias; crossing below −50 signals bearish momentum bias.
- Calculate Williams %R with length 14 on the 4-hour chart.
- Enter long when Williams %R crosses above −50 from below, indicating a shift from bearish to bullish momentum.
- Confirm with MACD: only enter long when the MACD histogram is positive (MACD line above signal line).
- Enter short when Williams %R crosses below −50 from above AND MACD histogram is negative.
- Stop-loss: 1.5× ATR(14) from entry in the direction of the trade.
- Exit long when Williams %R crosses back below −50; exit short when it crosses back above −50.
Strategy 3: Williams %R Bearish Divergence Short
Best for: Topping markets | Pairs with: RSI divergence confirmation
Bearish divergence between price and Williams %R is a high-reliability signal at market tops: price makes a higher high, but Williams %R makes a lower high, indicating weakening upside momentum.
- Identify a swing high where price makes a new high but Williams %R prints a lower peak than the previous high.
- Confirm the divergence on both Williams %R and RSI(14): both must show bearish divergence simultaneously.
- Wait for Williams %R to cross below −20 (exit overbought zone) as the trigger signal.
- Enter short on the bar that closes after Williams %R drops below −20.
- Stop-loss: above the most recent swing high that formed the divergence.
- Target: the prior swing low, or exit when Williams %R drops below −80 and begins forming a potential bottom.
For educational purposes only. Not investment advice. Past performance does not guarantee future results. Always backtest any strategy before using it with real capital.
How to Generate Williams %R Pine Script in Pineify
Pineify lets you generate a production-ready Williams %R Pine Script indicator in seconds — no coding required.
- 1
Open Pineify at pineify.app
Navigate to pineify.app and sign in or create a free account.
- 2
Click "New Indicator" in the dashboard
Select "Technical Indicator" as the type to access the full indicator library including momentum oscillators.
- 3
Describe your Williams %R configuration
Type your requirements, e.g. "Williams %R with length 14, overbought at −20, oversold at −80, with a midline at −50." Pineify understands natural language descriptions.
- 4
Copy the generated Pine Script v6 code
Pineify generates complete, runnable code with
ta.wpr(), horizontal reference levels, and band fill already configured. Click "Copy" to get the code. - 5
Adjust parameters and add to your TradingView chart
Paste the code into TradingView Pine Script Editor (Alt+P), click "Add to chart," and adjust the length and overbought/oversold thresholds directly from the indicator settings panel.
Williams %R Pine Script FAQ
Related Pine Script Indicators
Generate Williams %R Pine Script in Seconds
Stop copying and pasting scripts manually. Pineify generates production-ready Pine Script v6 Williams %R code with your exact parameters — for free.
Try Pineify for Free