TradingView Backtesting: Inspect Rules, Fills, and Results
A TradingView backtest runs a Pine strategy against historical chart data using the broker emulator. It answers how specified rules behaved under that dataset and execution model. It does not show exactly how every live trade would have filled.
Build explicit rules
Use the visual editor to configure calculations, entry conditions, exit rules, and position sizing, then inspect the generated strategy in TradingView. Start with Create Your First Strategy.
An indicator cannot be meaningfully backtested without decisions about when to enter, how much to trade, when to exit, and which data was available at each decision. Results from unconfirmed higher-timeframe values or future-looking inputs may be misleading.
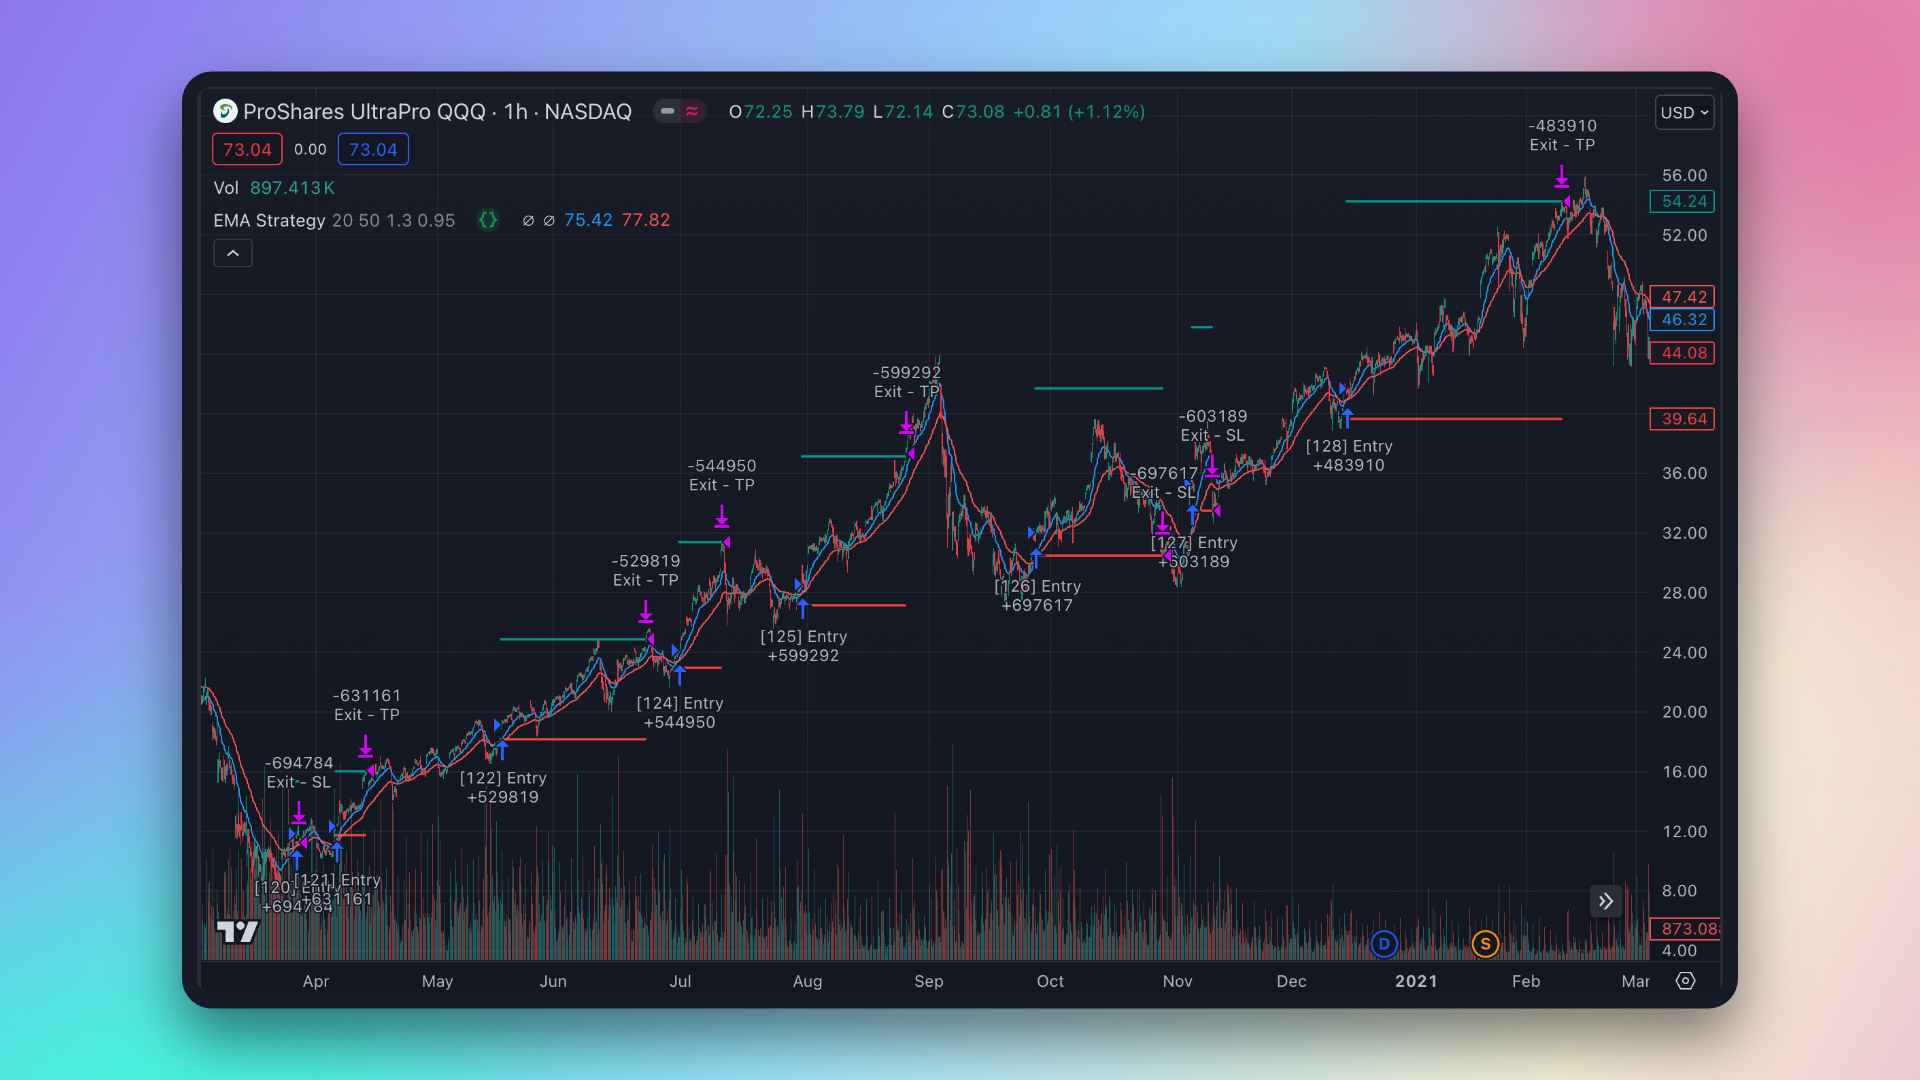
The screenshot illustrates the output location, not a verified performance claim for this tutorial.
Set the test conditions
Record the instrument, timeframe, date range, inputs, starting capital, position sizing, commission, and slippage. Inspect the calculation and fill settings. Bar Magnifier can refine historical intrabar assumptions where lower-timeframe data is available, but it does not reproduce all live-market conditions.
Validate a sample of entries and exits against the trade list. Distinguish the signal price, order creation time, and actual simulated fill. See TradingView's strategy documentation for the execution model.
Interpret the metrics
Profit factor compares gross profit with gross loss. A value above one means gross profit exceeded gross loss in that test; no universal cutoff establishes robustness or future profitability.
Maximum drawdown describes the largest reported decline from a prior equity peak under the tester's calculation. It is an observed result, not a bound on future loss.
Win rate and average win/loss should be read together with costs and sample size. A high win rate can coexist with a losing strategy.
Sharpe ratio compares excess returns over a risk-free benchmark with return variability. A value above one does not establish outperformance against a buy-and-hold asset. Compare the appropriate benchmark separately using compatible periods and assumptions. See TradingView's Sharpe definition.
Check common failure modes
- Overfitting: Selecting rules or parameters because they fit the same sample used for evaluation.
- Missing costs: Ignoring spreads, fees, slippage, financing, or liquidity constraints relevant to the instrument.
- Biased data selection: Choosing only surviving symbols or favorable date ranges.
- Repainting or future leakage: Using values that were not available when a historical decision would have occurred.
- Execution mismatch: Assuming the requested order price always equals its fill, or ignoring when the order first exists.
Separate development from evaluation
Keep a development sample and a later evaluation sample. Record unsuccessful variants as well as the selected one. If using rolling or walk-forward evaluation, define the training and evaluation windows before reviewing results; this is a research method, not a claim that the visual editor automatically performs it.
A single-symbol TradingView result is not a combined portfolio simulation. Correlations, capital allocation, and simultaneous positions need separate portfolio-level analysis. Do not infer those capabilities from a list of individual backtests.
Keep the result reproducible
Save the script version, inputs, properties, dates, and exported trades. Re-run the same configuration before comparing a revision. Inspect an independent period and forward behavior before relying on a result; no backtest eliminates trading risk.