How to Use More Than 2 Indicators in TradingView (Actually Works in 2025)
You know that frustrating moment when you're analyzing a chart and TradingView hits you with the dreaded "indicator limit reached" message? Yeah, I've been there too. Staring at my chart with just two indicators, feeling like I was trying to read a book with half the pages missing.
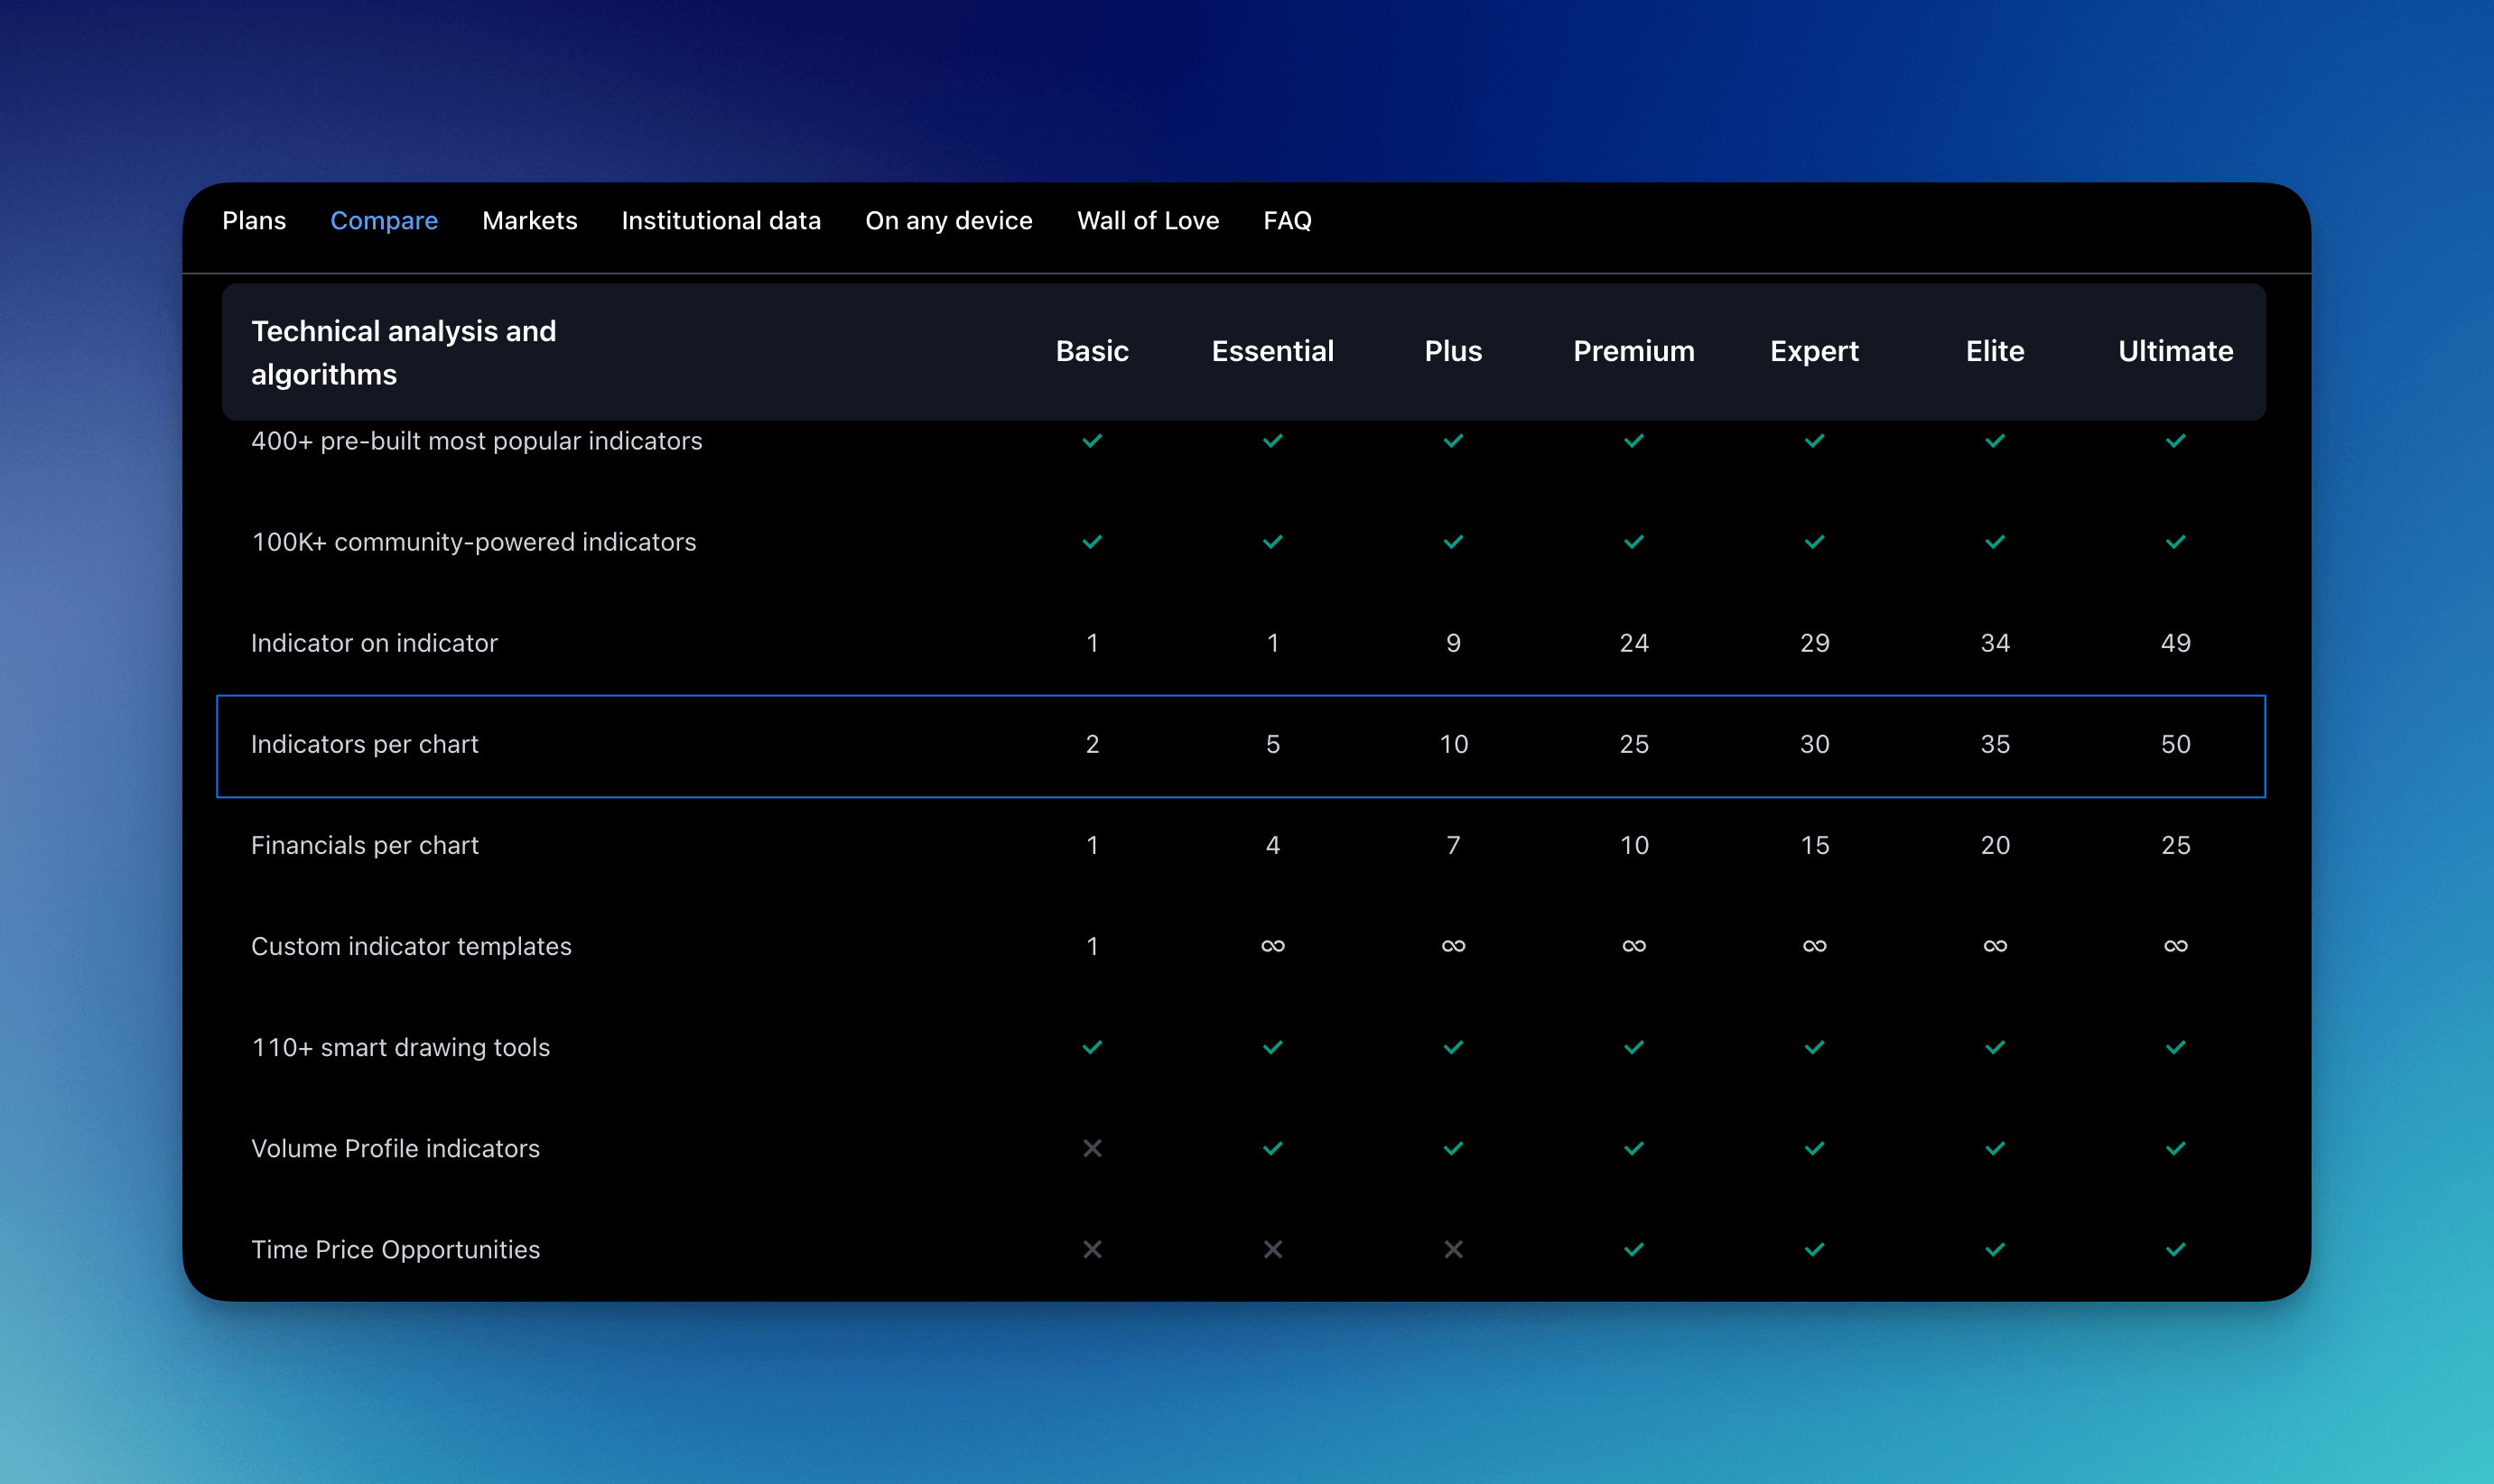
The free version of TradingView only lets you use two indicators per chart, which honestly feels pretty limiting when you're trying to do serious technical analysis. It's like being handed a toolbox with only a hammer and a screwdriver - sure, you can get some work done, but you're missing out on so much more.
But here's what changed everything for me: I discovered there's actually a legitimate way to combine multiple indicators into a single custom one. No rule-breaking, no sketchy workarounds, just a clever approach that TradingView's own system supports.
The secret sauce? Using a visual indicator builder called Pineify that lets you package multiple indicators into one cohesive Pine Script. You build your multi-indicator setup visually, copy the generated code, and add it to TradingView as a single custom indicator. Suddenly, that two-indicator limit becomes irrelevant because you're getting 5, 10, or even 20 indicators all bundled together.
How to Actually Add Unlimited Indicators (The Step-by-Step Process)
Here's what makes this approach so brilliant: Pineify works like a visual indicator builder that requires zero coding knowledge. You simply add the indicators you want from their library, adjust the settings, and it generates production-ready Pine Script code that you can immediately paste into TradingView.
Think of it like building a custom dashboard - you select all the tools you need (your indicators), and Pineify packages them into one streamlined indicator that TradingView treats as a single element.
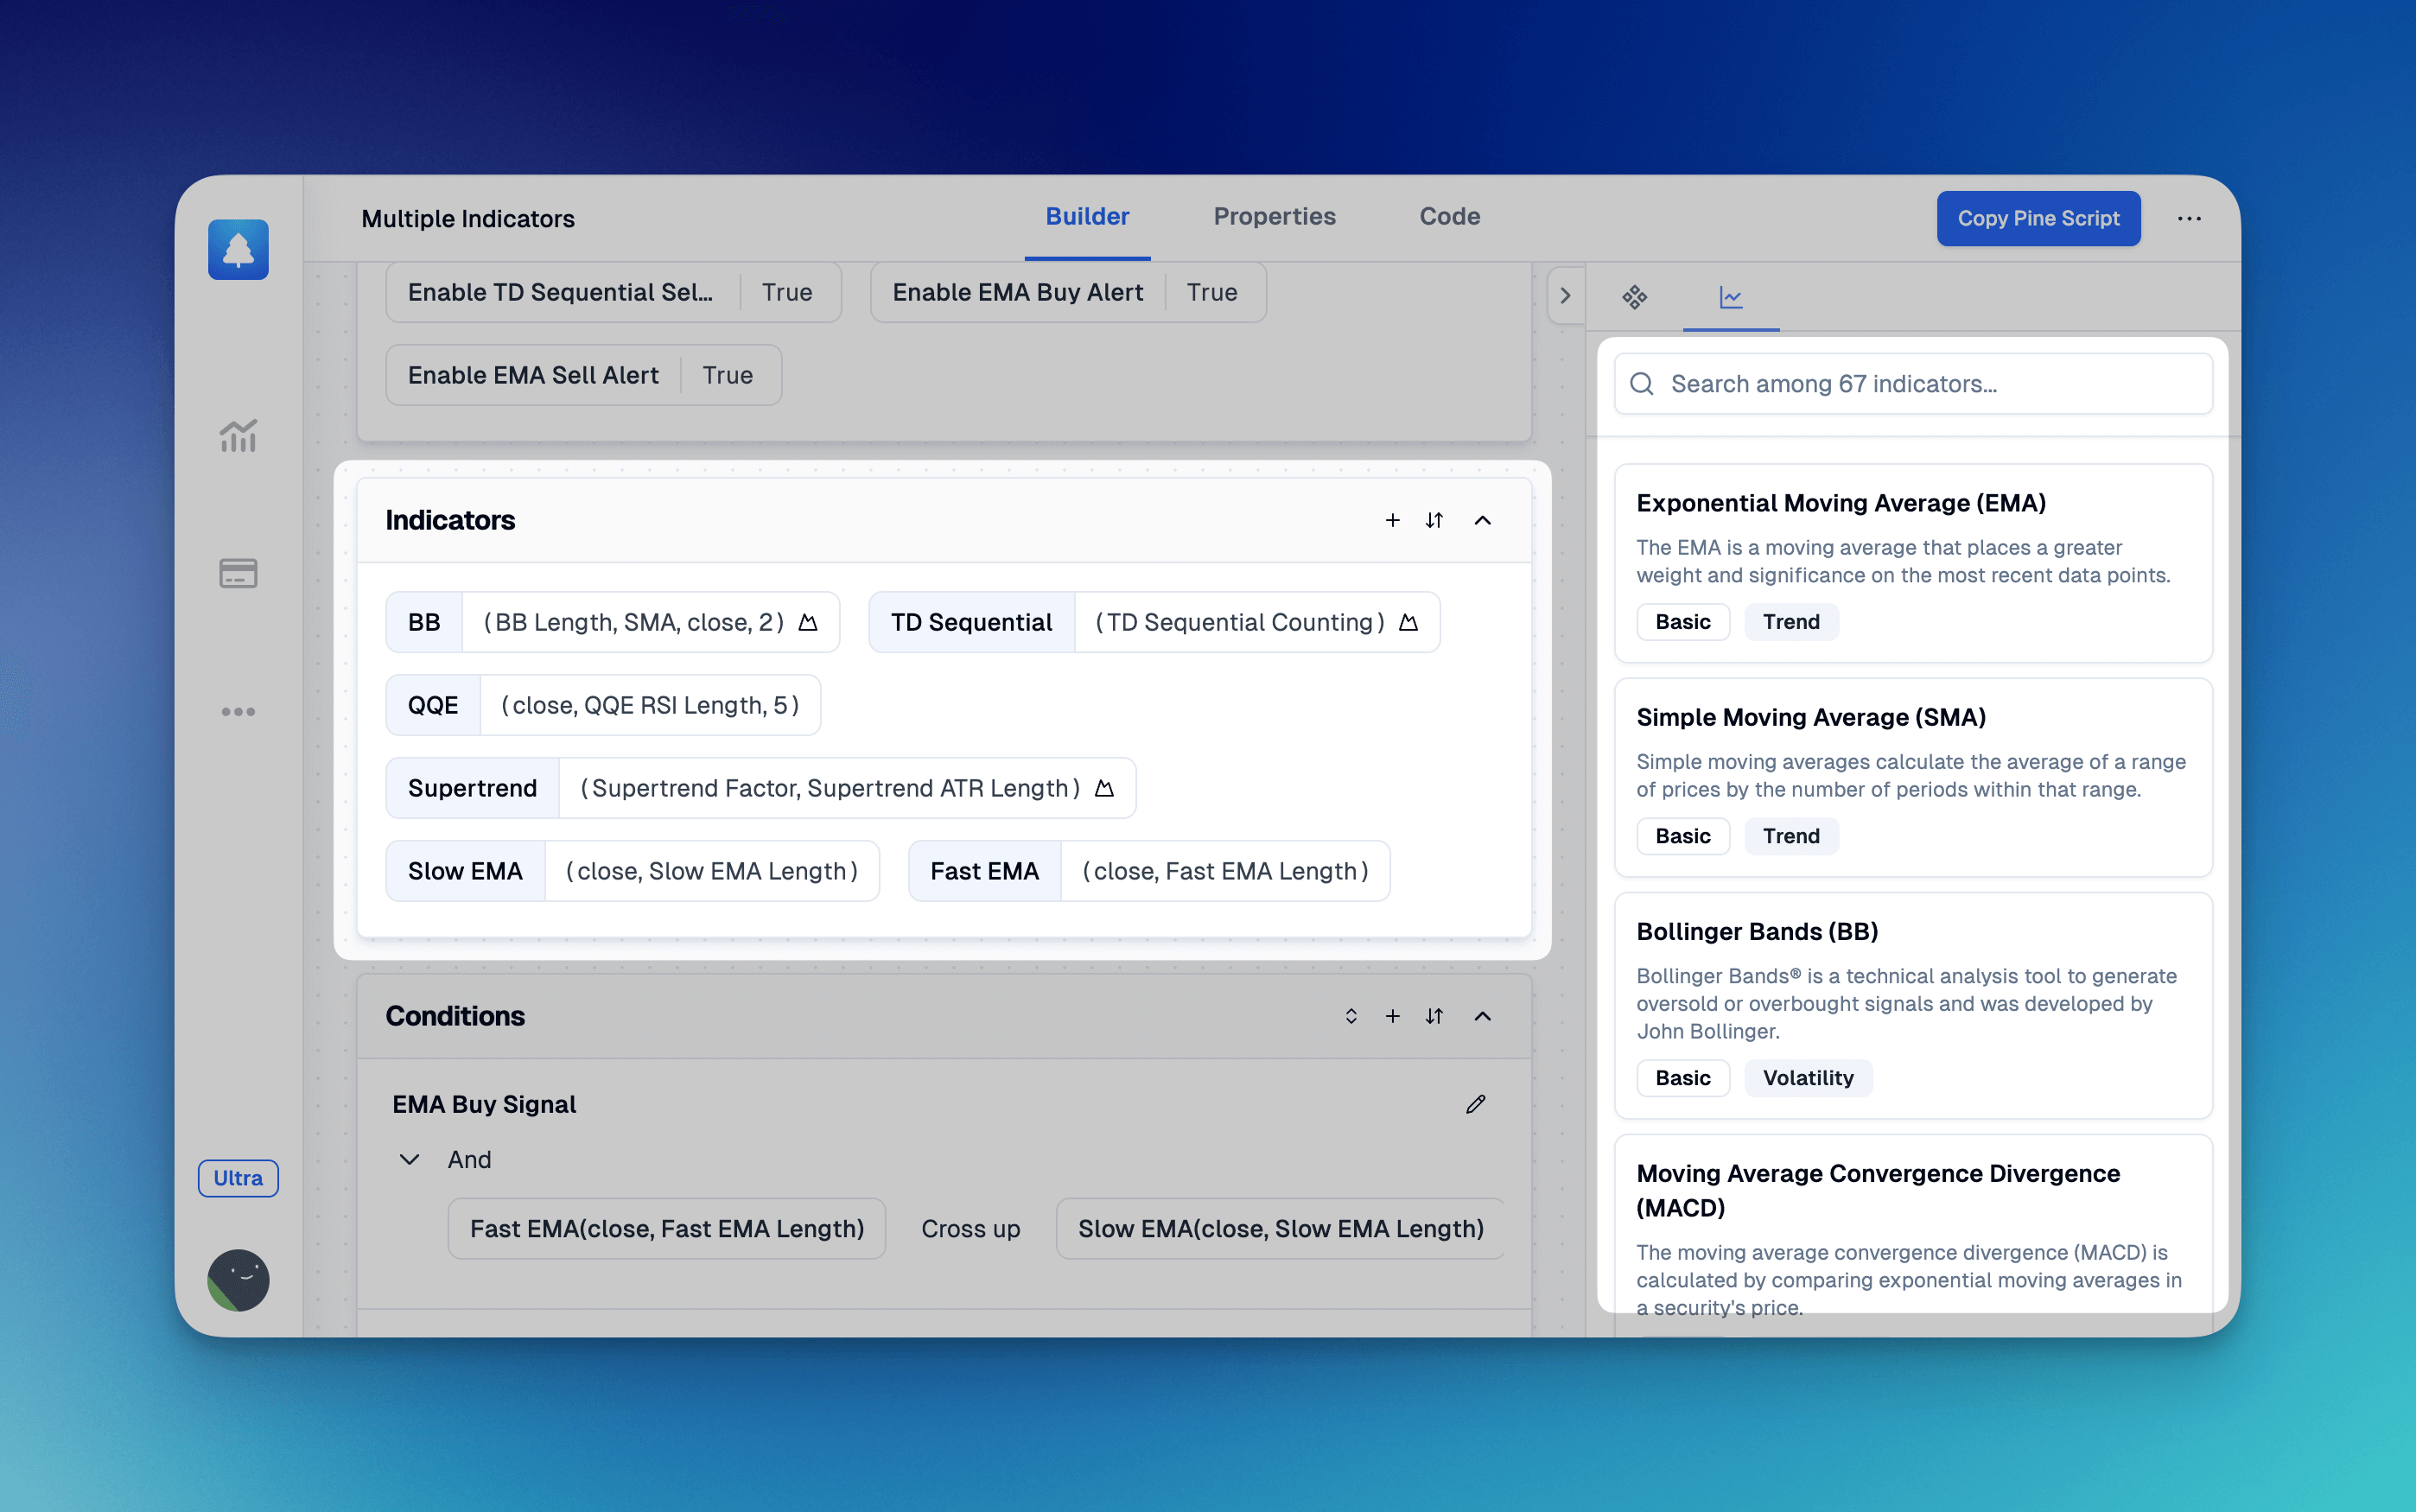
The interface is refreshingly simple - you browse indicators from the library on the right, add them to your workspace on the left, and configure each one's settings. The platform includes 83+ core indicators covering all the essentials like EMA, SMA, Bollinger Bands, MACD, Supertrend, QQE, and RSI.
What's really cool is how responsive they are to user feedback. If you need a specific indicator that's not in their library yet, you can request it and they typically add it within a few weeks. It's like having a development team that actually listens to traders.
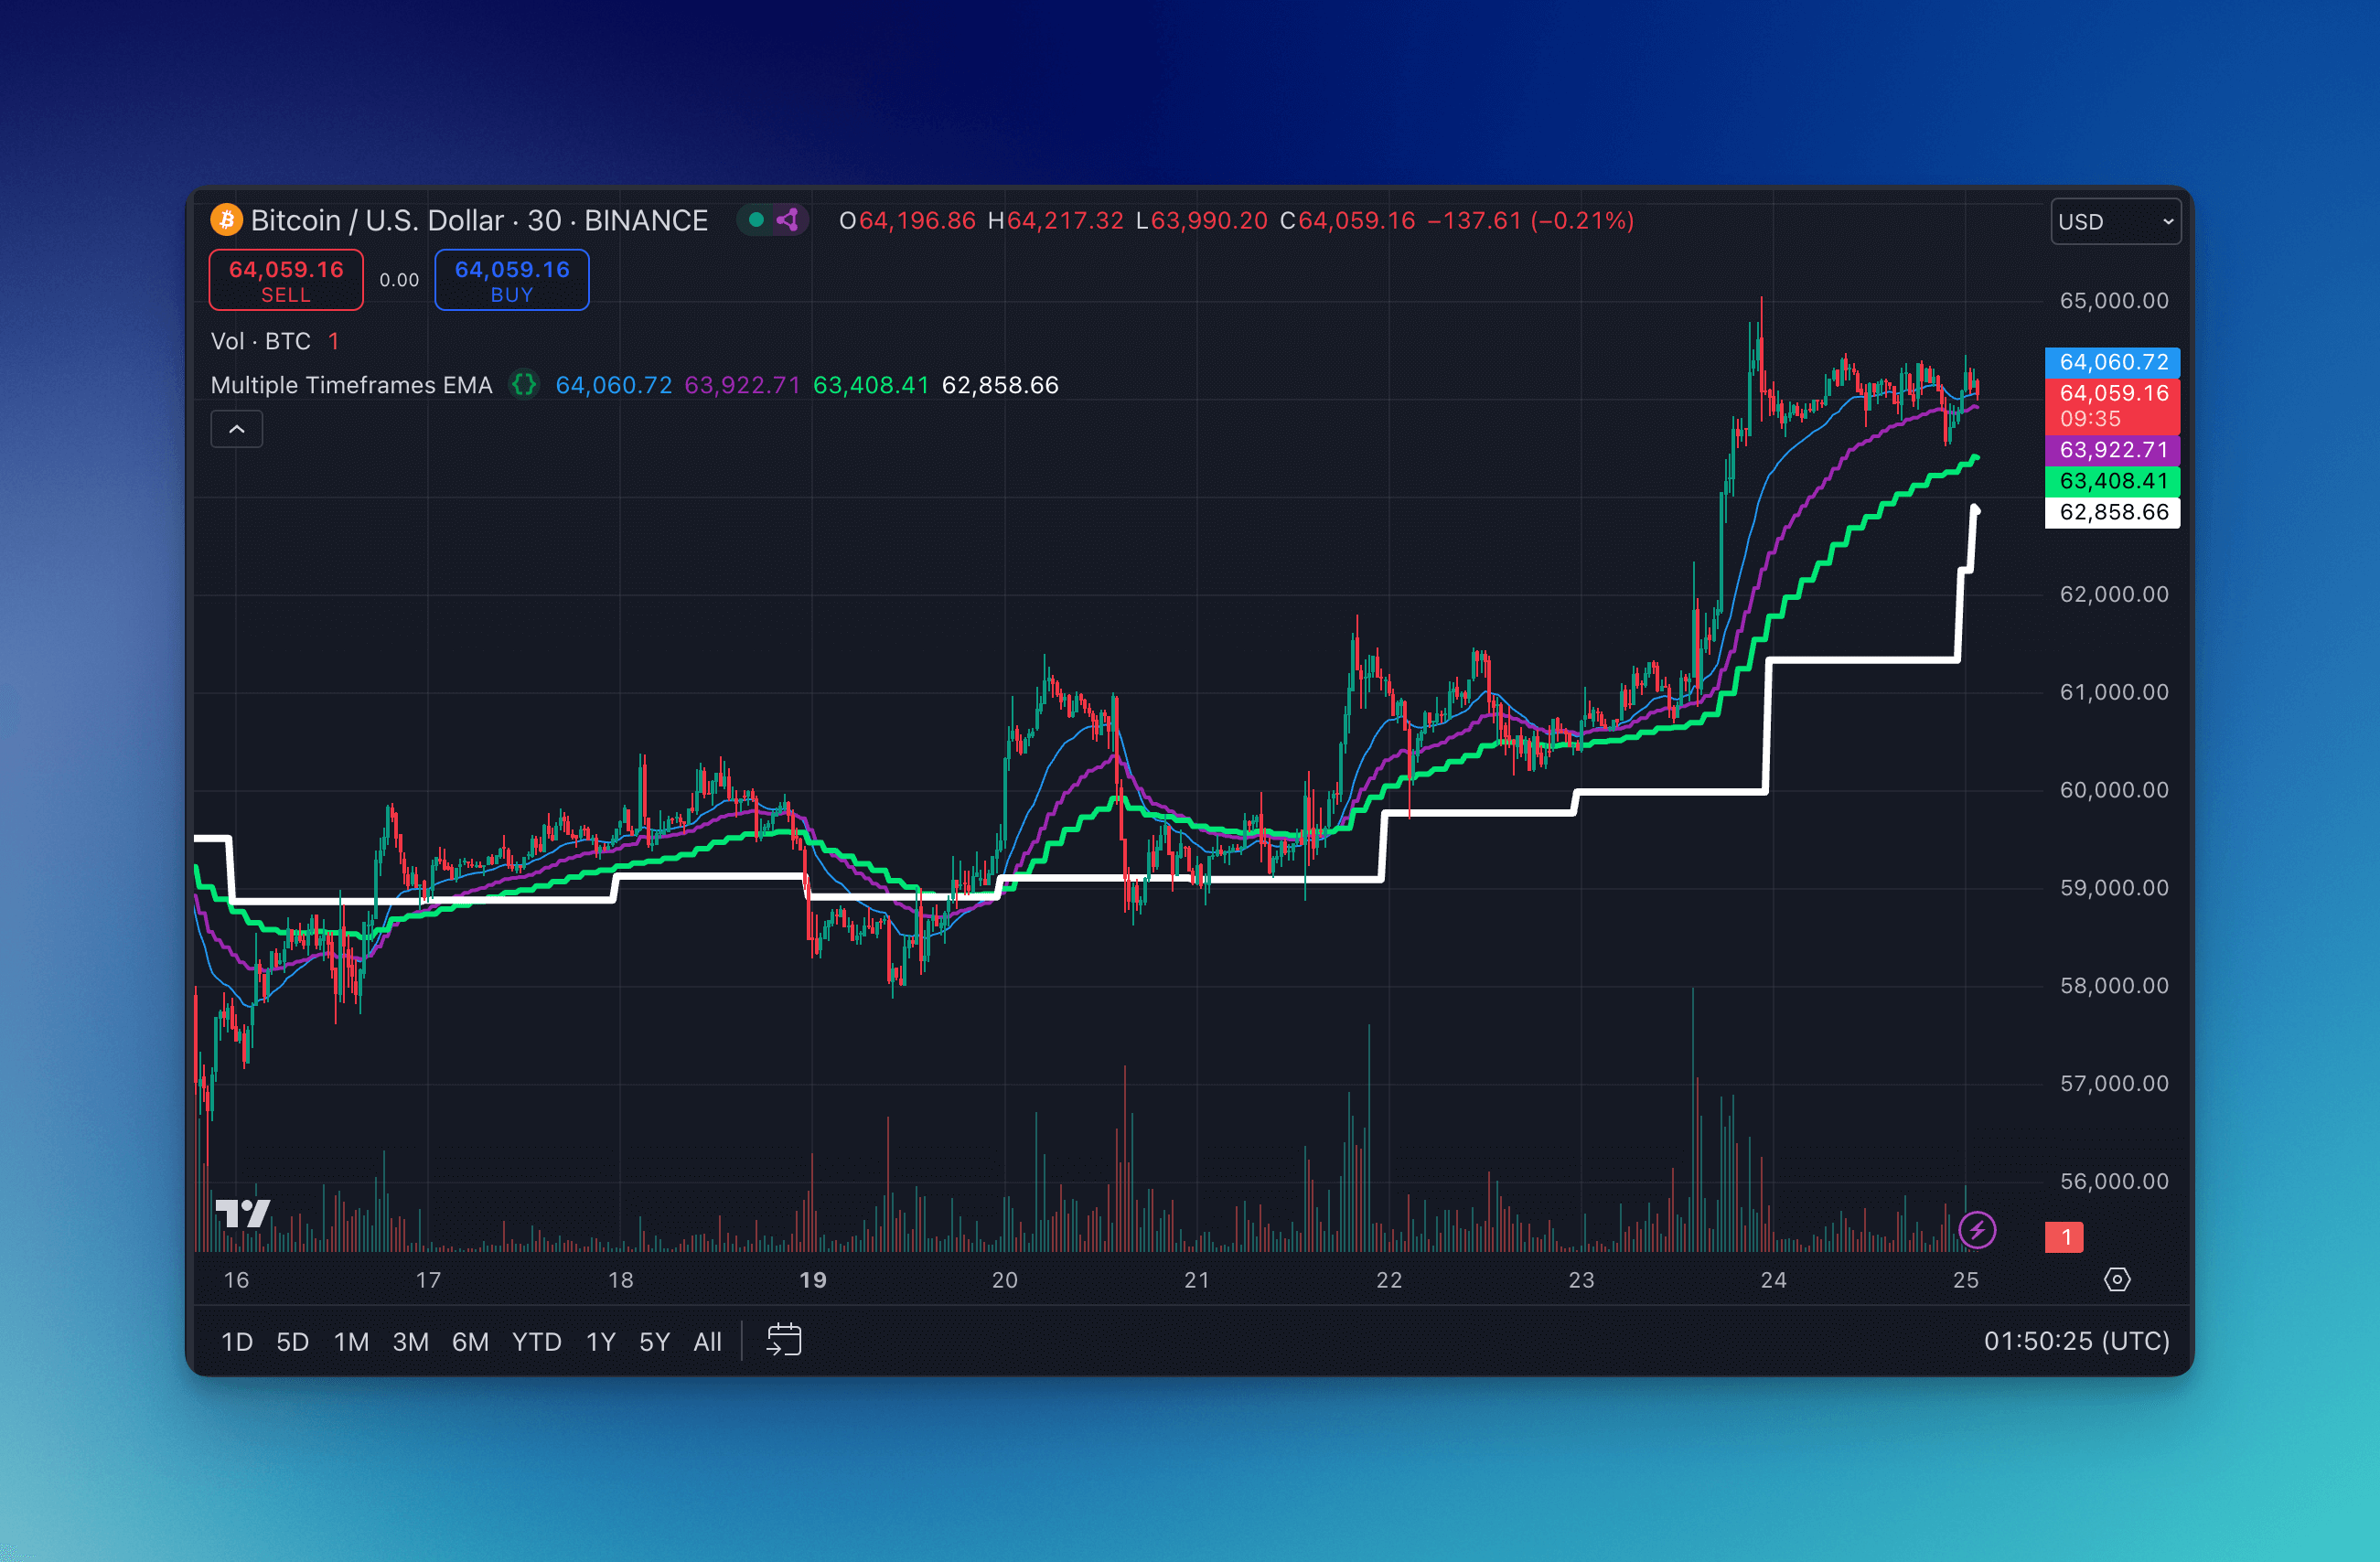
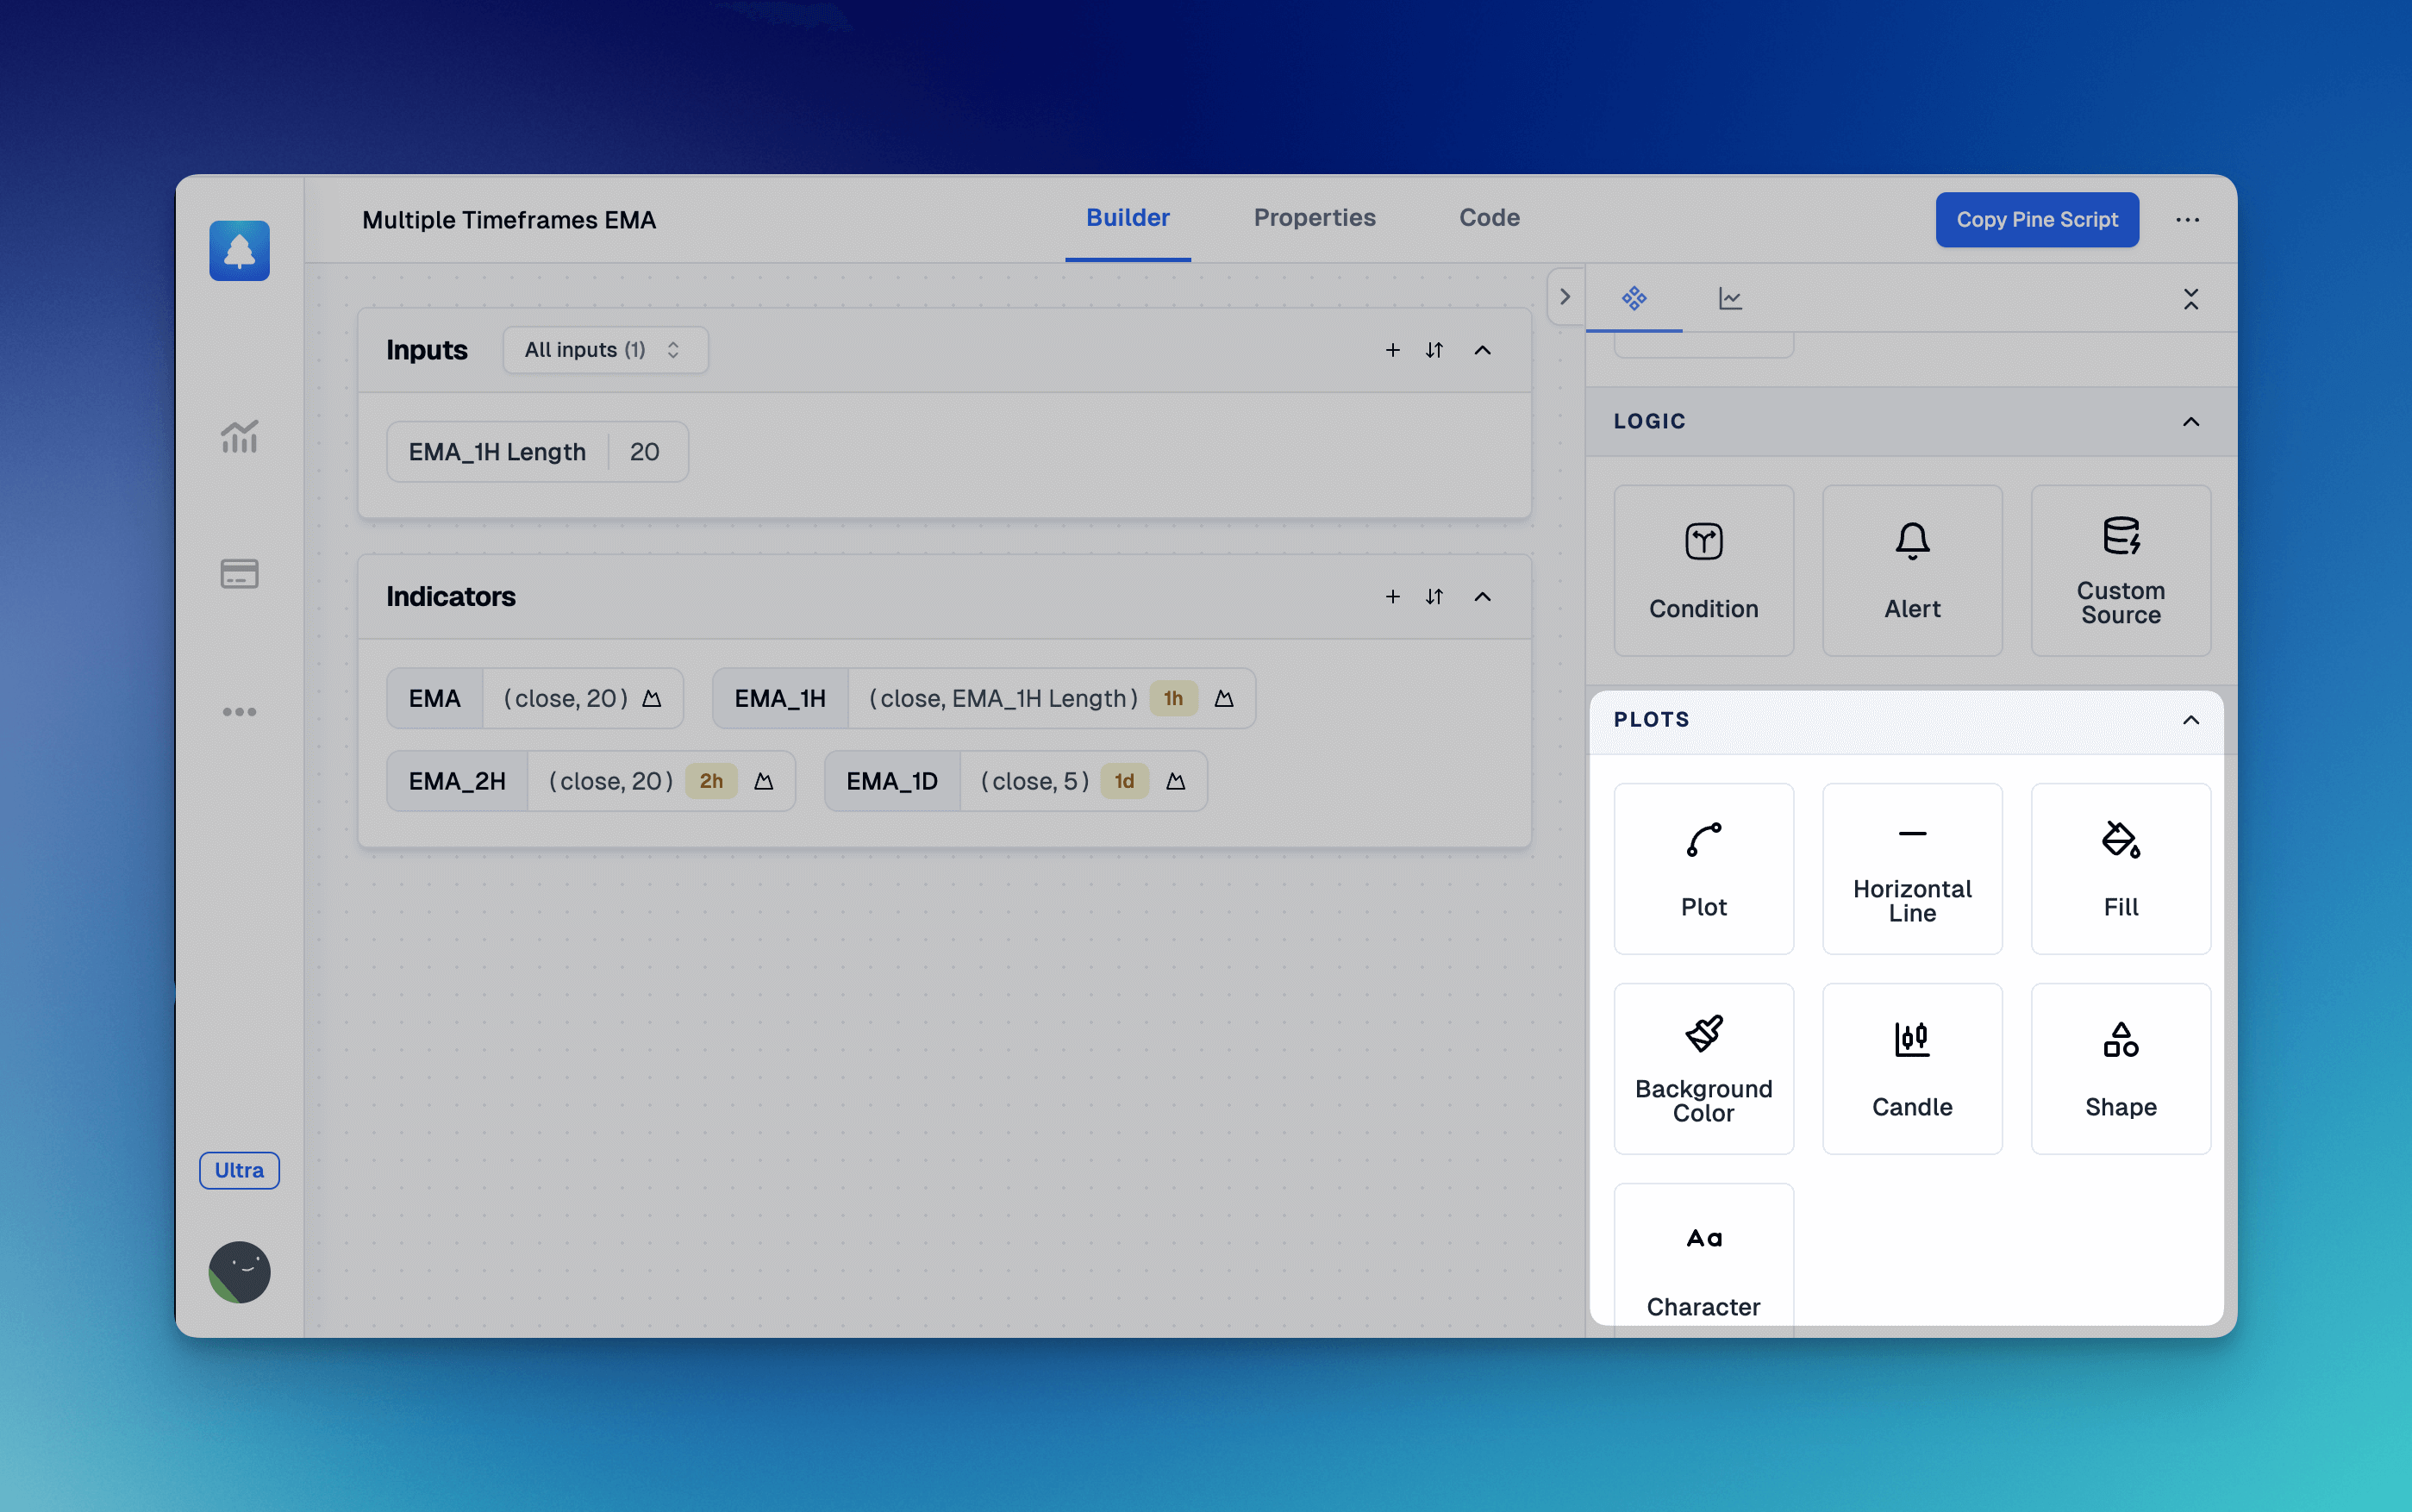
The Game-Changer: Multi-Timeframe Analysis on One Chart
Here's where this approach gets really powerful - you're not limited to indicators from your current chart timeframe. You can pull in data from different timeframes and even completely different symbols all on the same chart.
Picture this: you're analyzing a 15-minute chart but want to see what the 1-hour and daily trends are telling you. Instead of constantly switching between different chart windows, you can display all those timeframe indicators right on your current view. It's like having a trader's dream setup with multiple monitors, but everything's on one screen.
The setup process is straightforward - when adding each indicator, you simply specify which timeframe and symbol you want it to analyze:
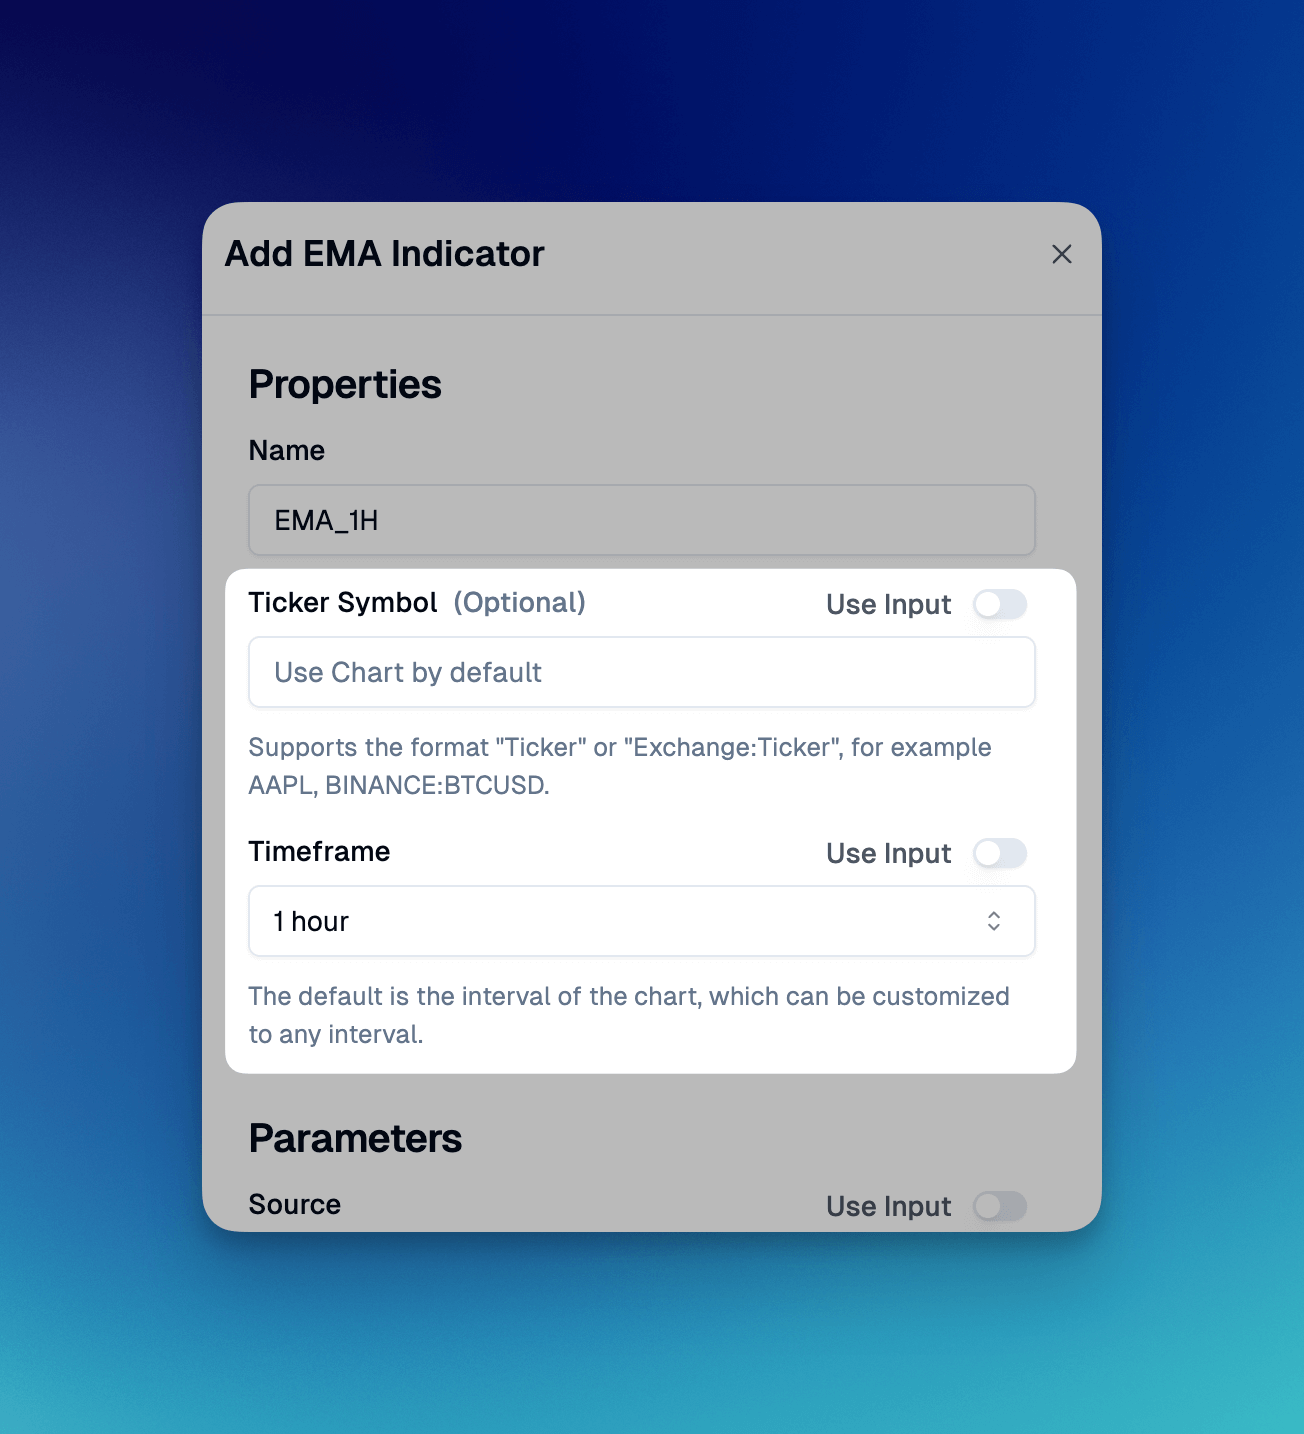
The workspace clearly shows which timeframe and symbol each indicator is pulling from, eliminating any confusion about your data sources. This transparency is crucial when you're making trading decisions based on multiple timeframe analysis.
When you're satisfied with your configuration, click "Copy Pine Script" and paste the generated code into TradingView's Pine Editor. Add it to your chart and watch your comprehensive indicator setup come to life.
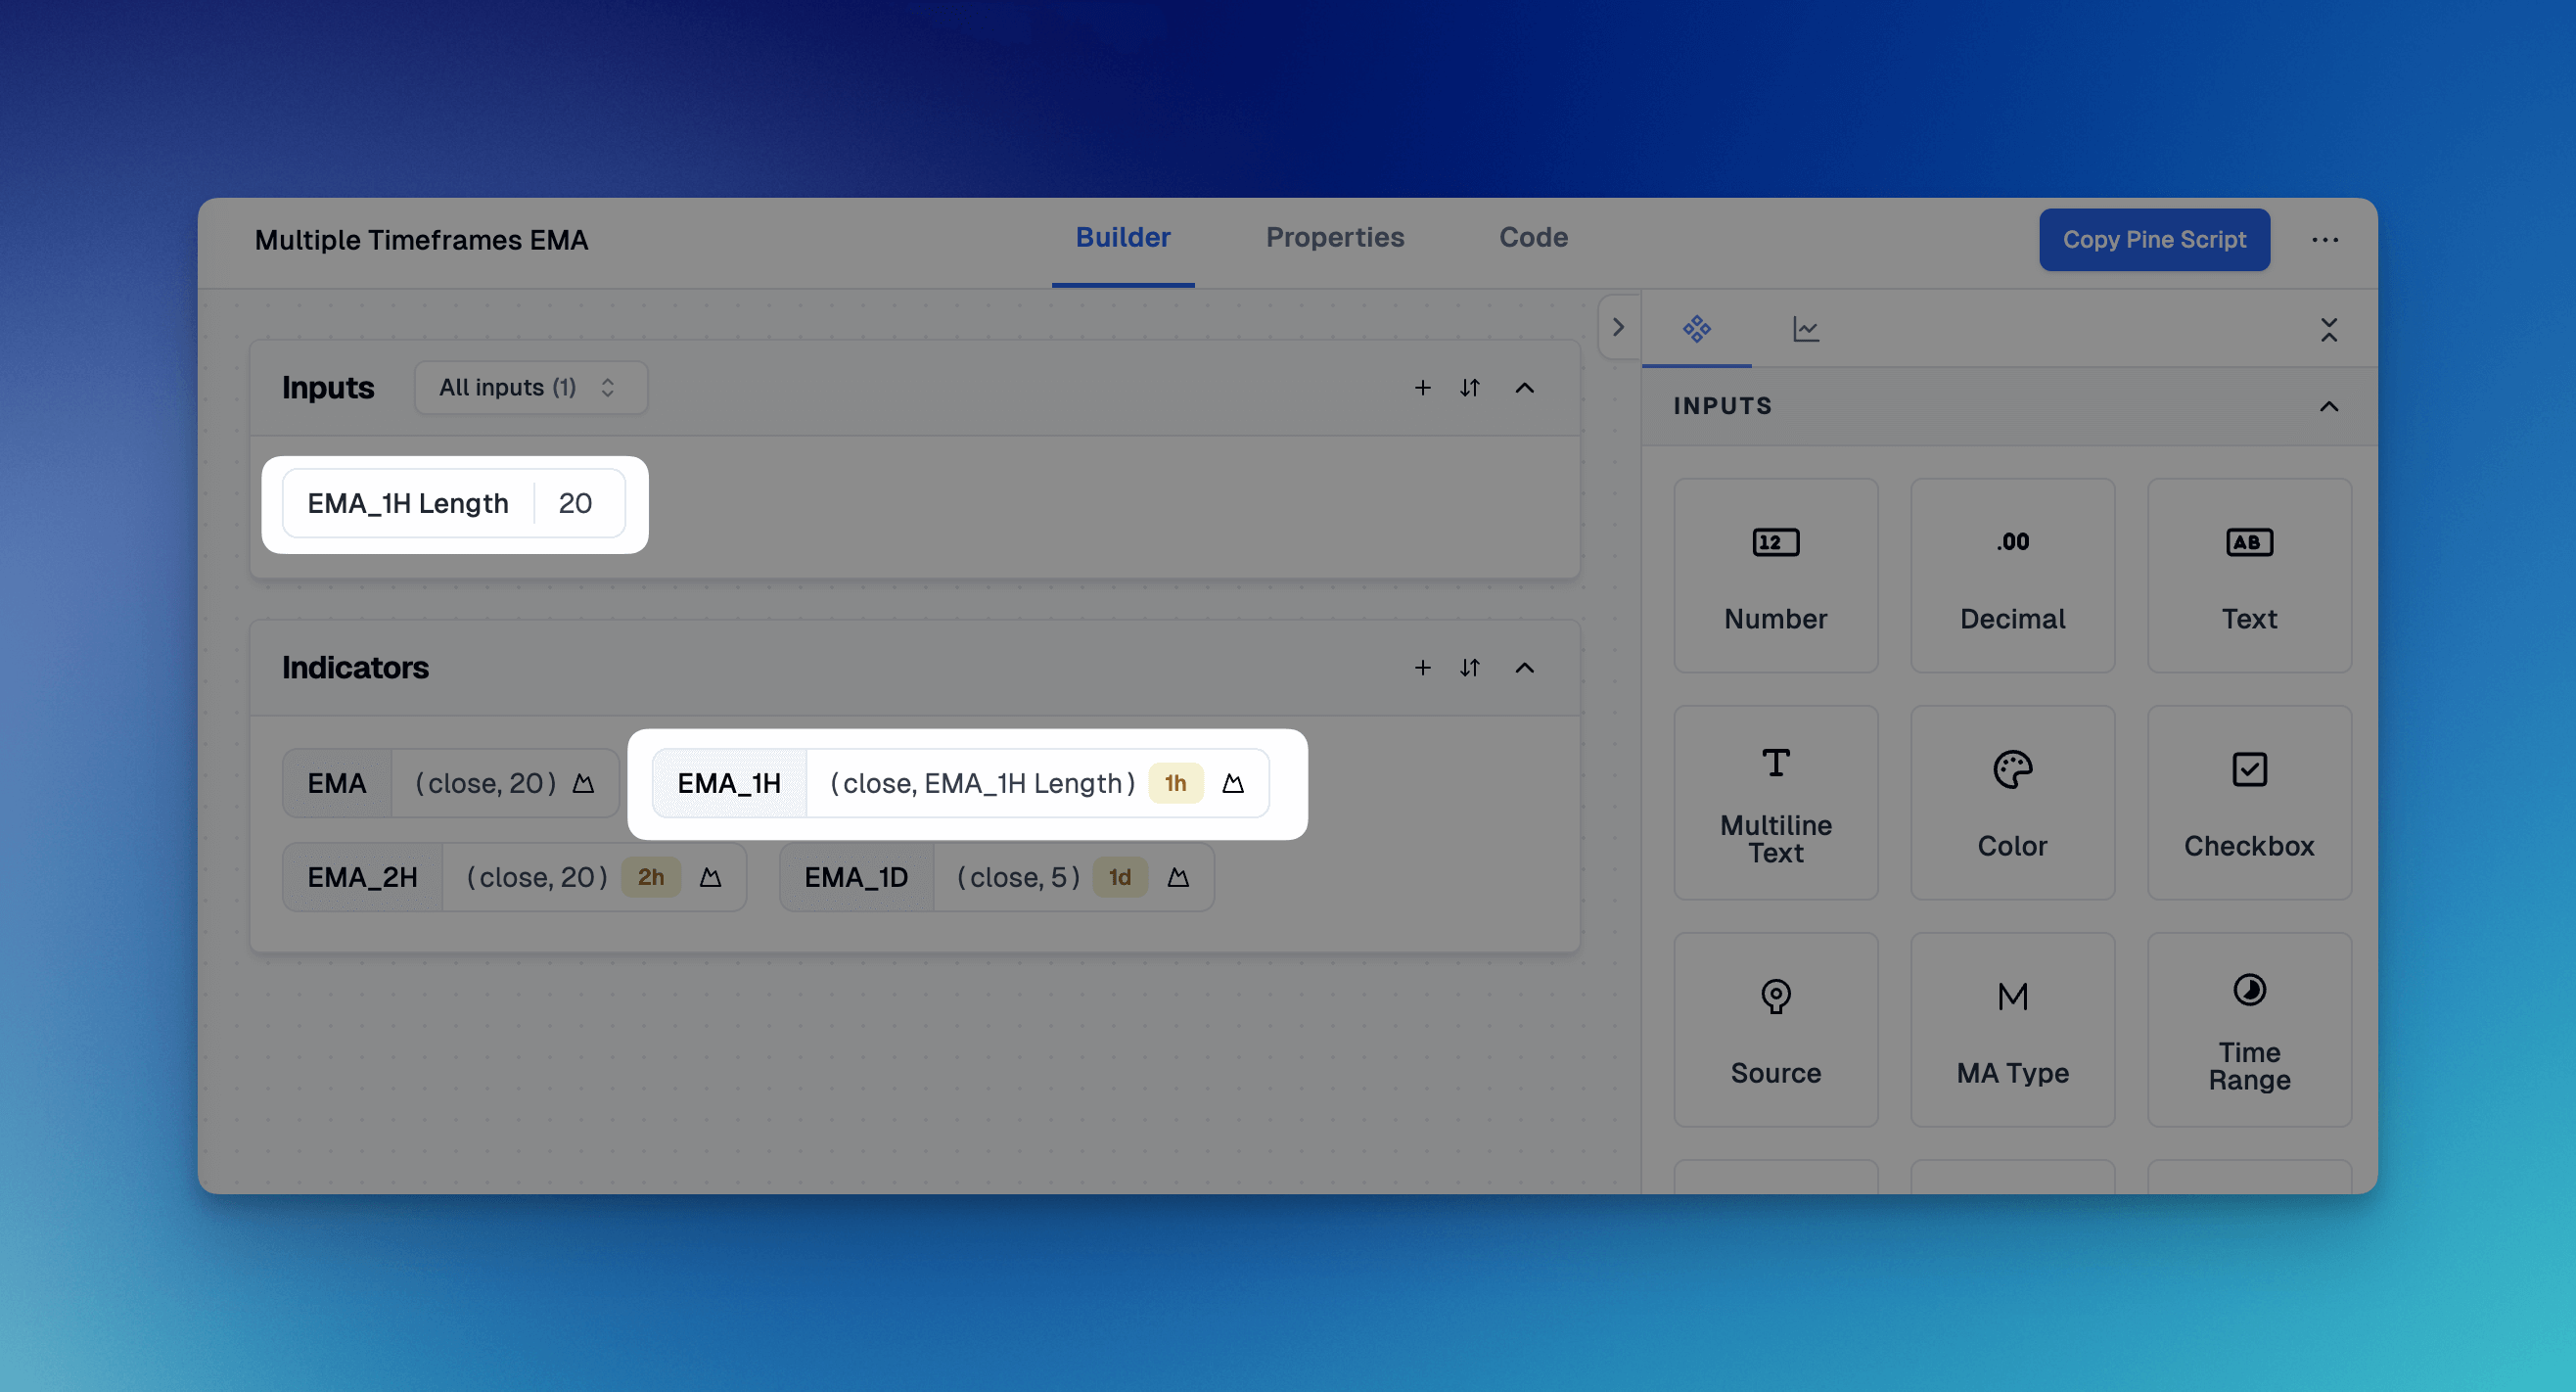
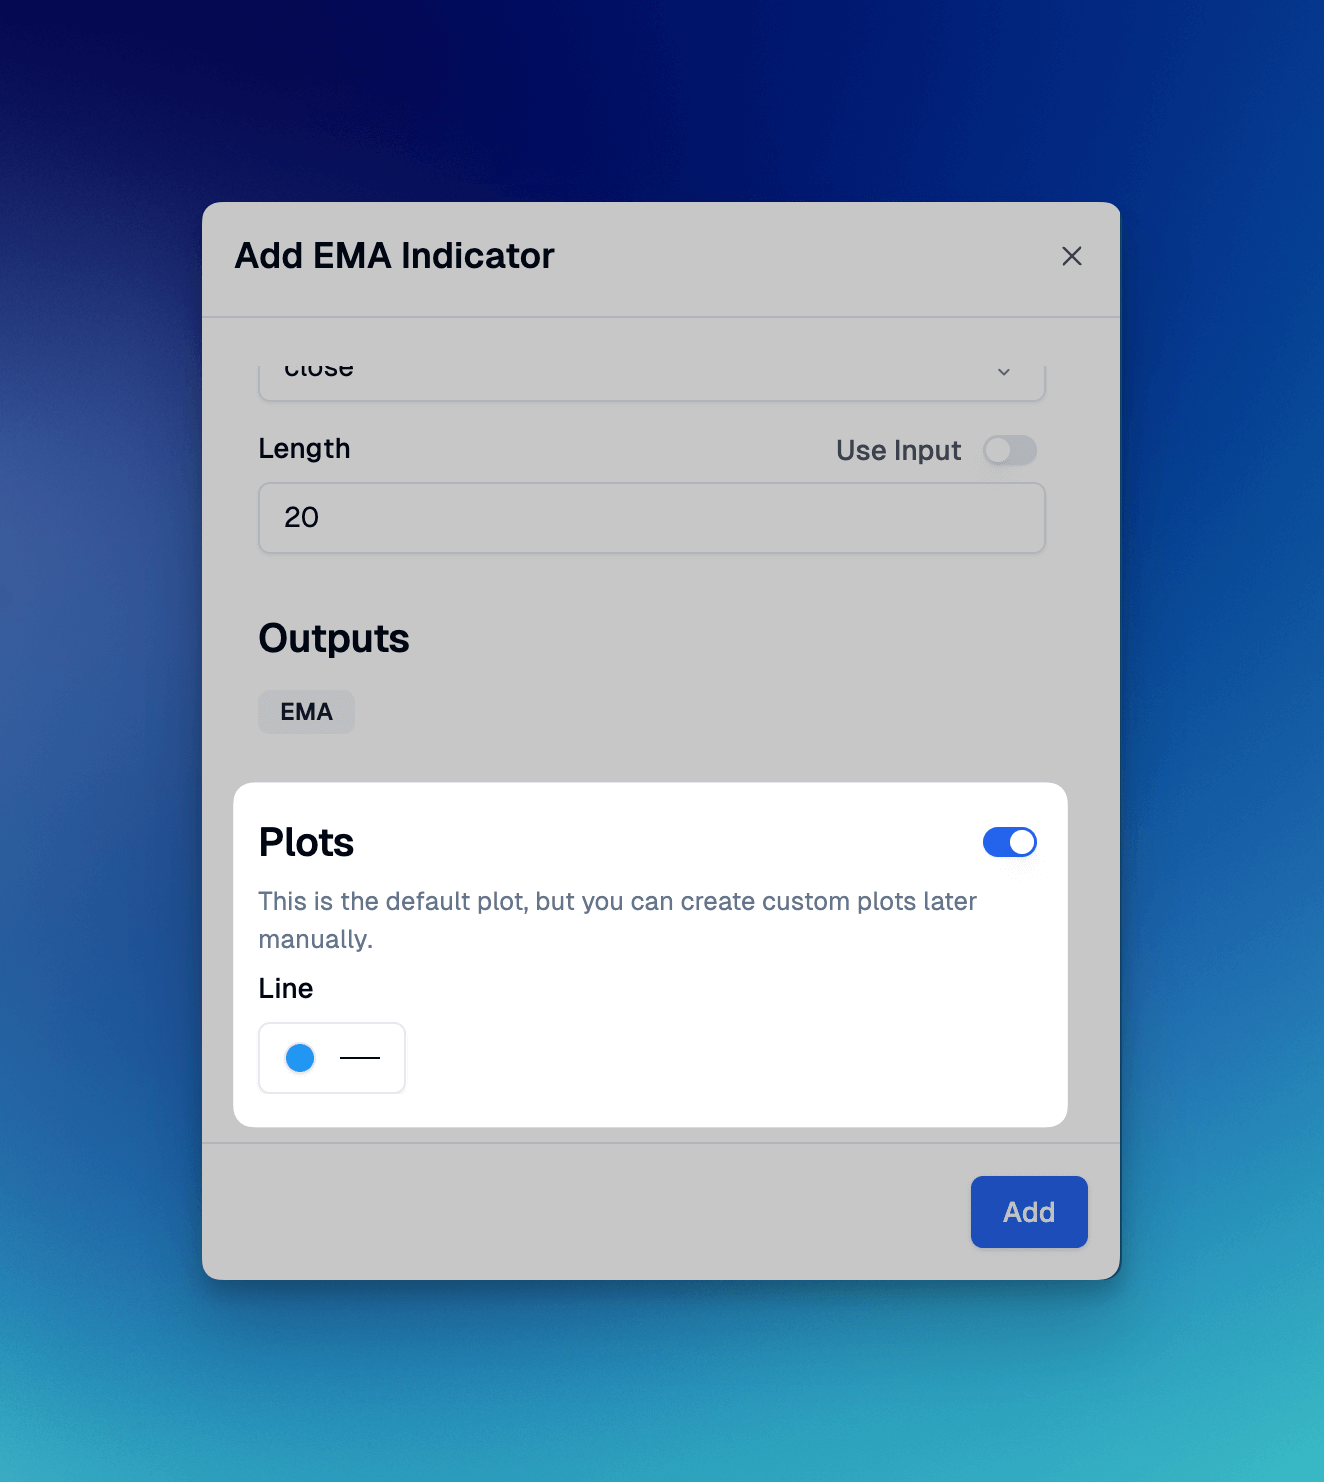
Building in Flexibility: Making Your Indicators Adjustable
One feature that really impressed me is how easily you can make your indicators customizable right from the start. When configuring any indicator parameter, you can select "Custom" which creates adjustable inputs that appear in TradingView's settings panel later.
This forward-thinking approach means you won't need to return to Pineify every time you want to fine-tune a moving average period or modify an RSI threshold. You build the flexibility into your indicator from day one, saving tons of time down the road.
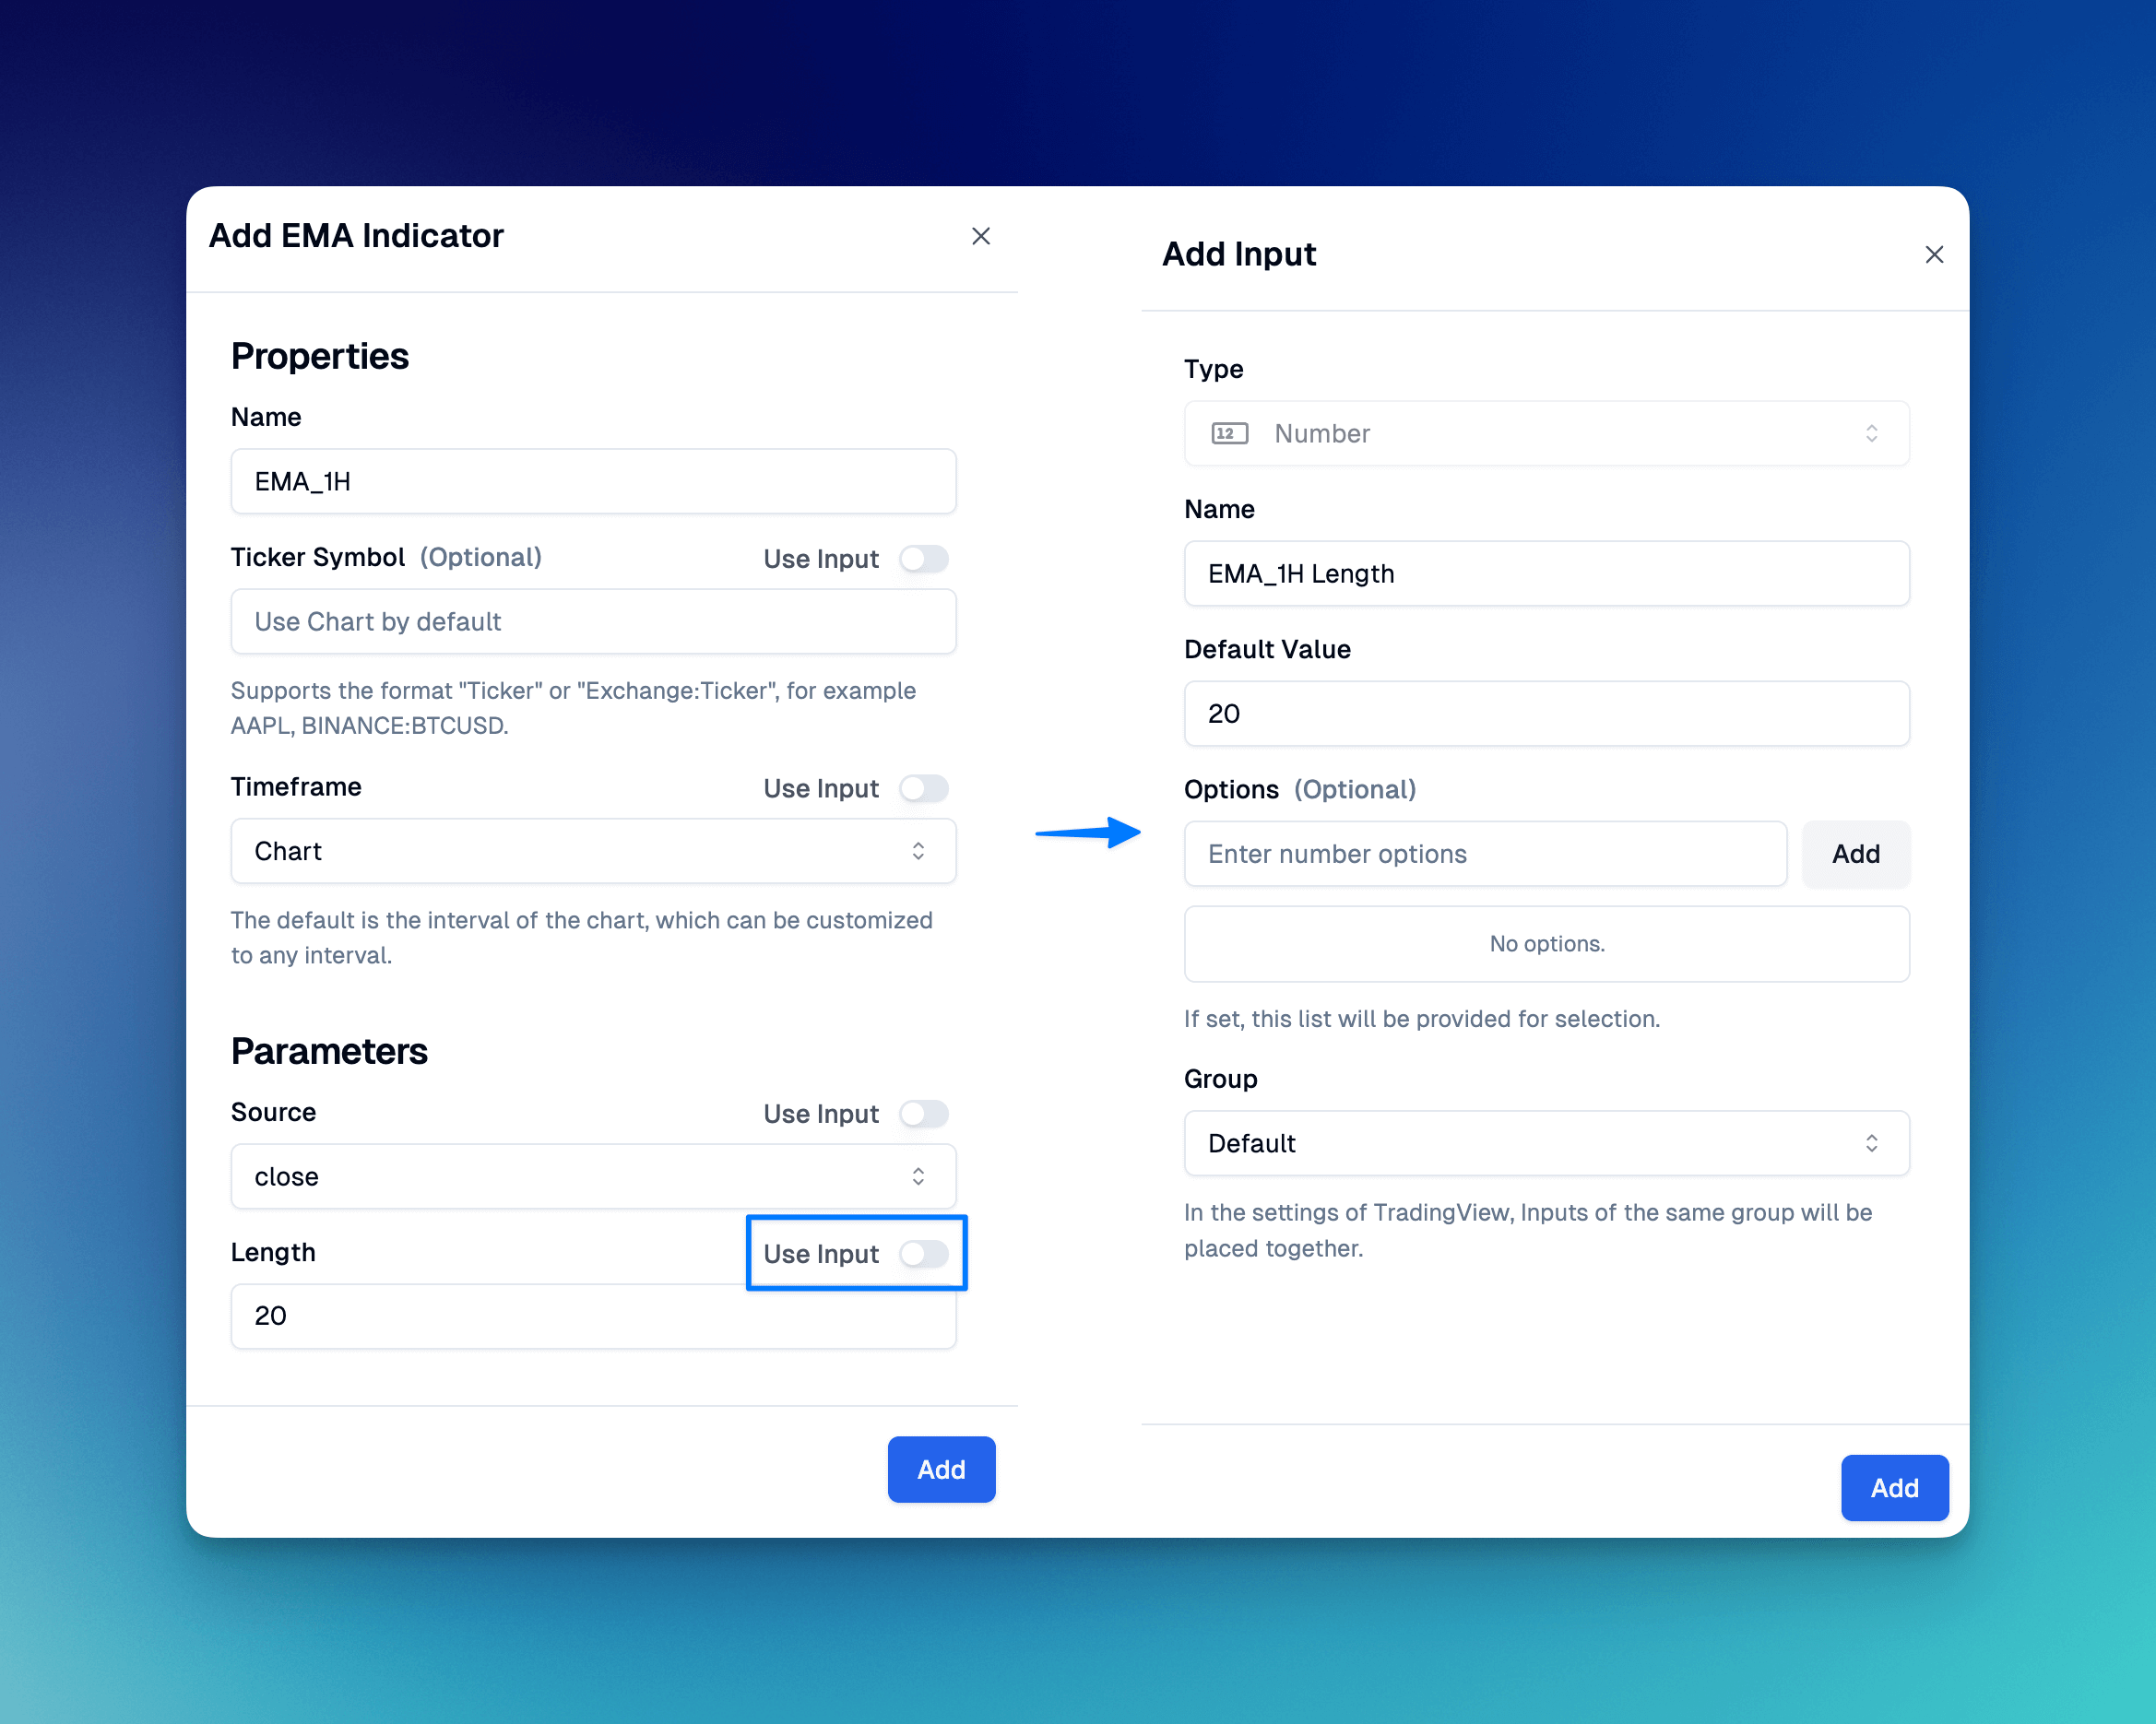
The visual interface clearly shows how your custom inputs connect to each indicator, making it easy to understand what controls what. This transparency prevents confusion when you're adjusting settings later in TradingView.
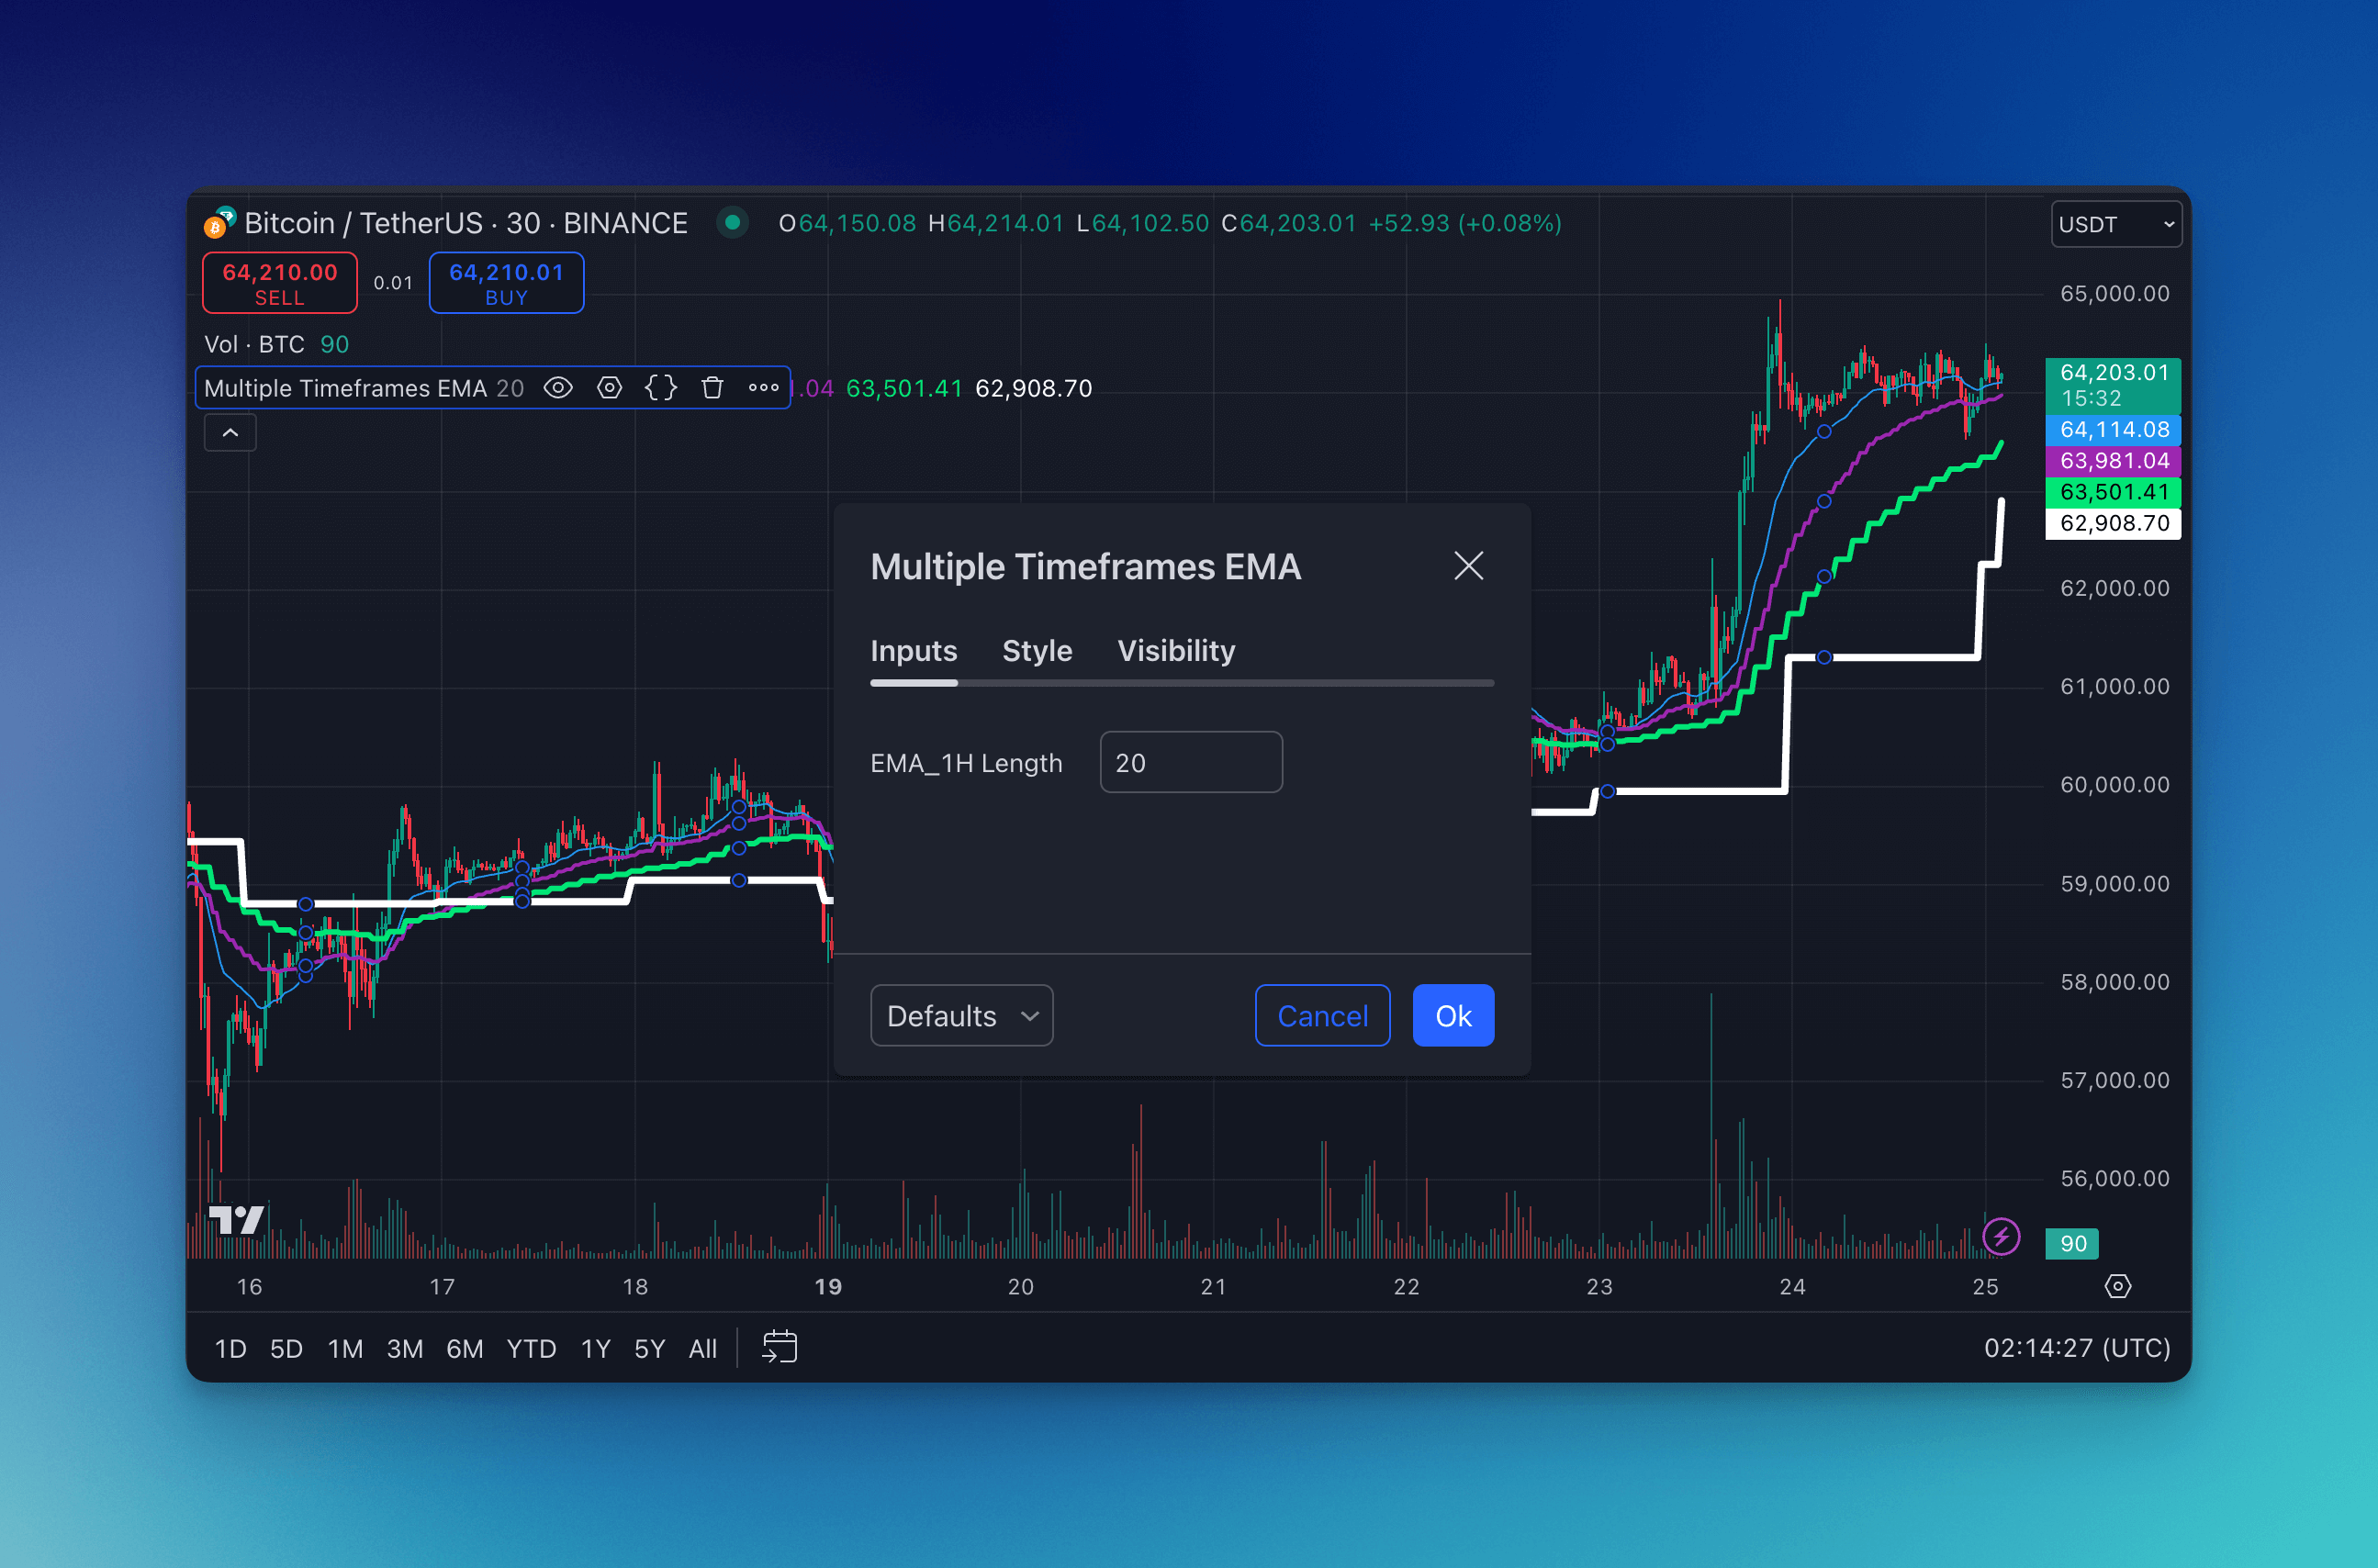
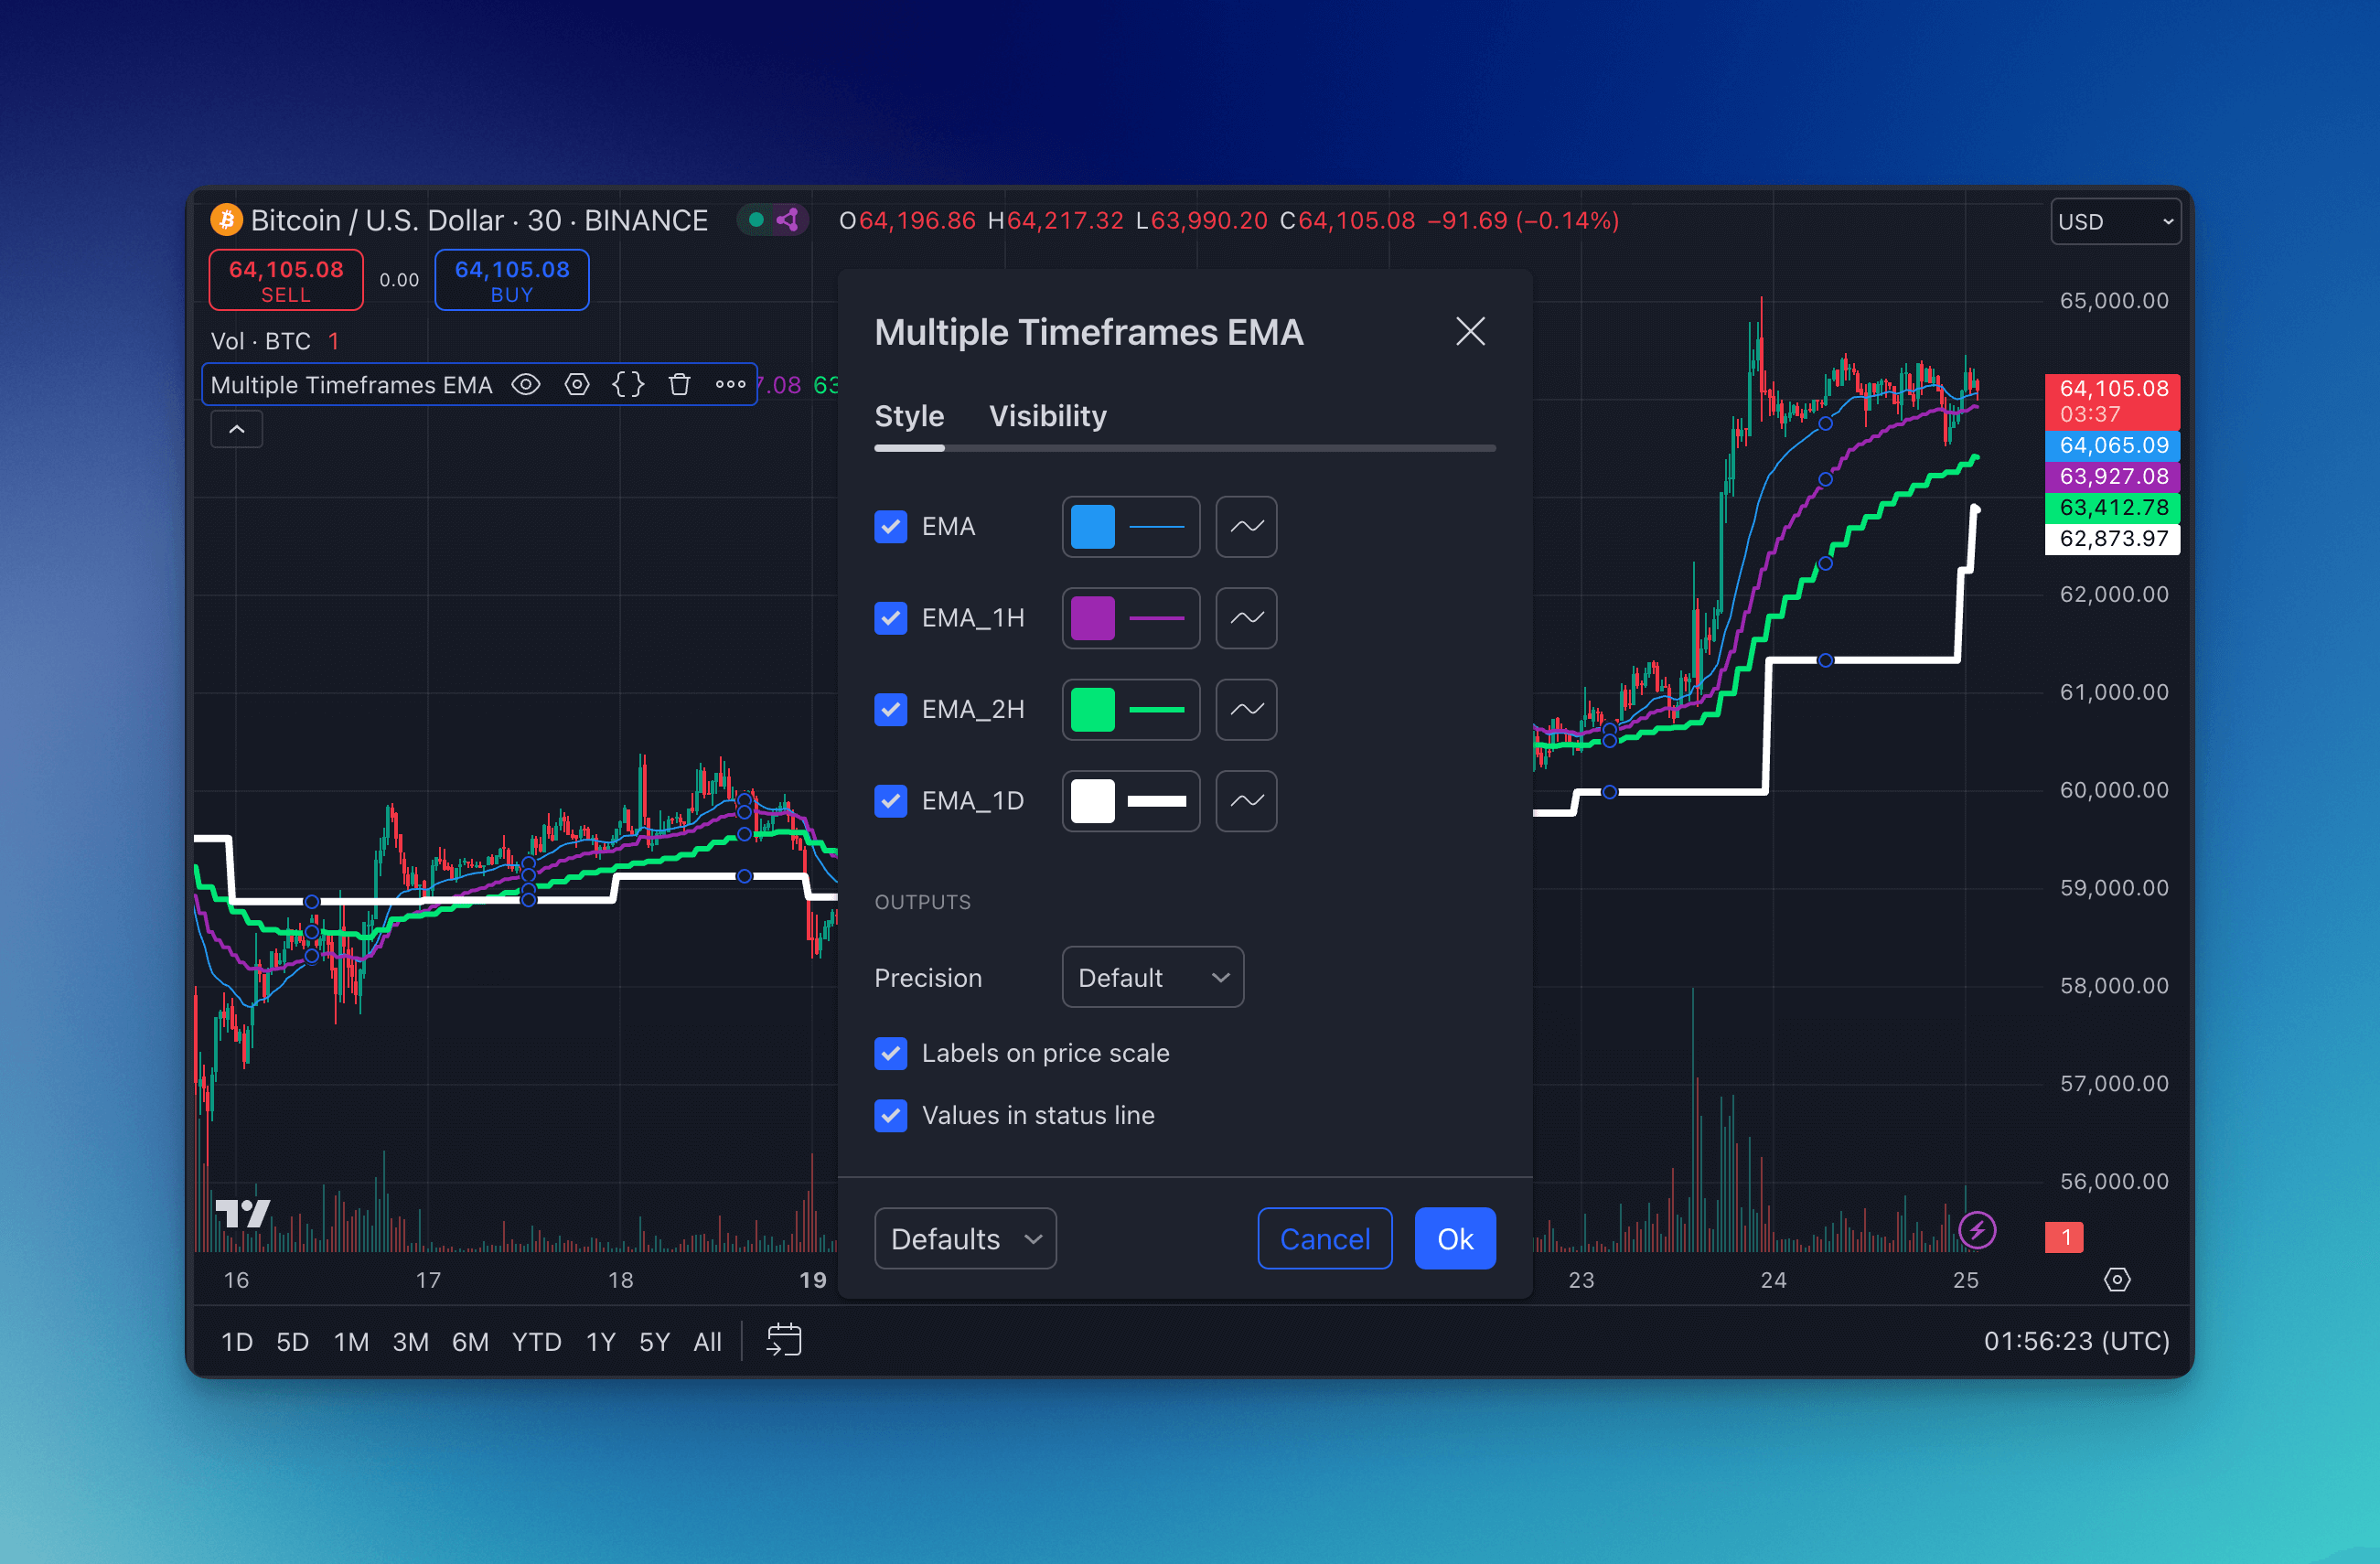
Once you add your custom indicator to TradingView, you get a professional settings panel where you can adjust all your parameters in real-time:
Visual Customization: Making Your Charts Work for You
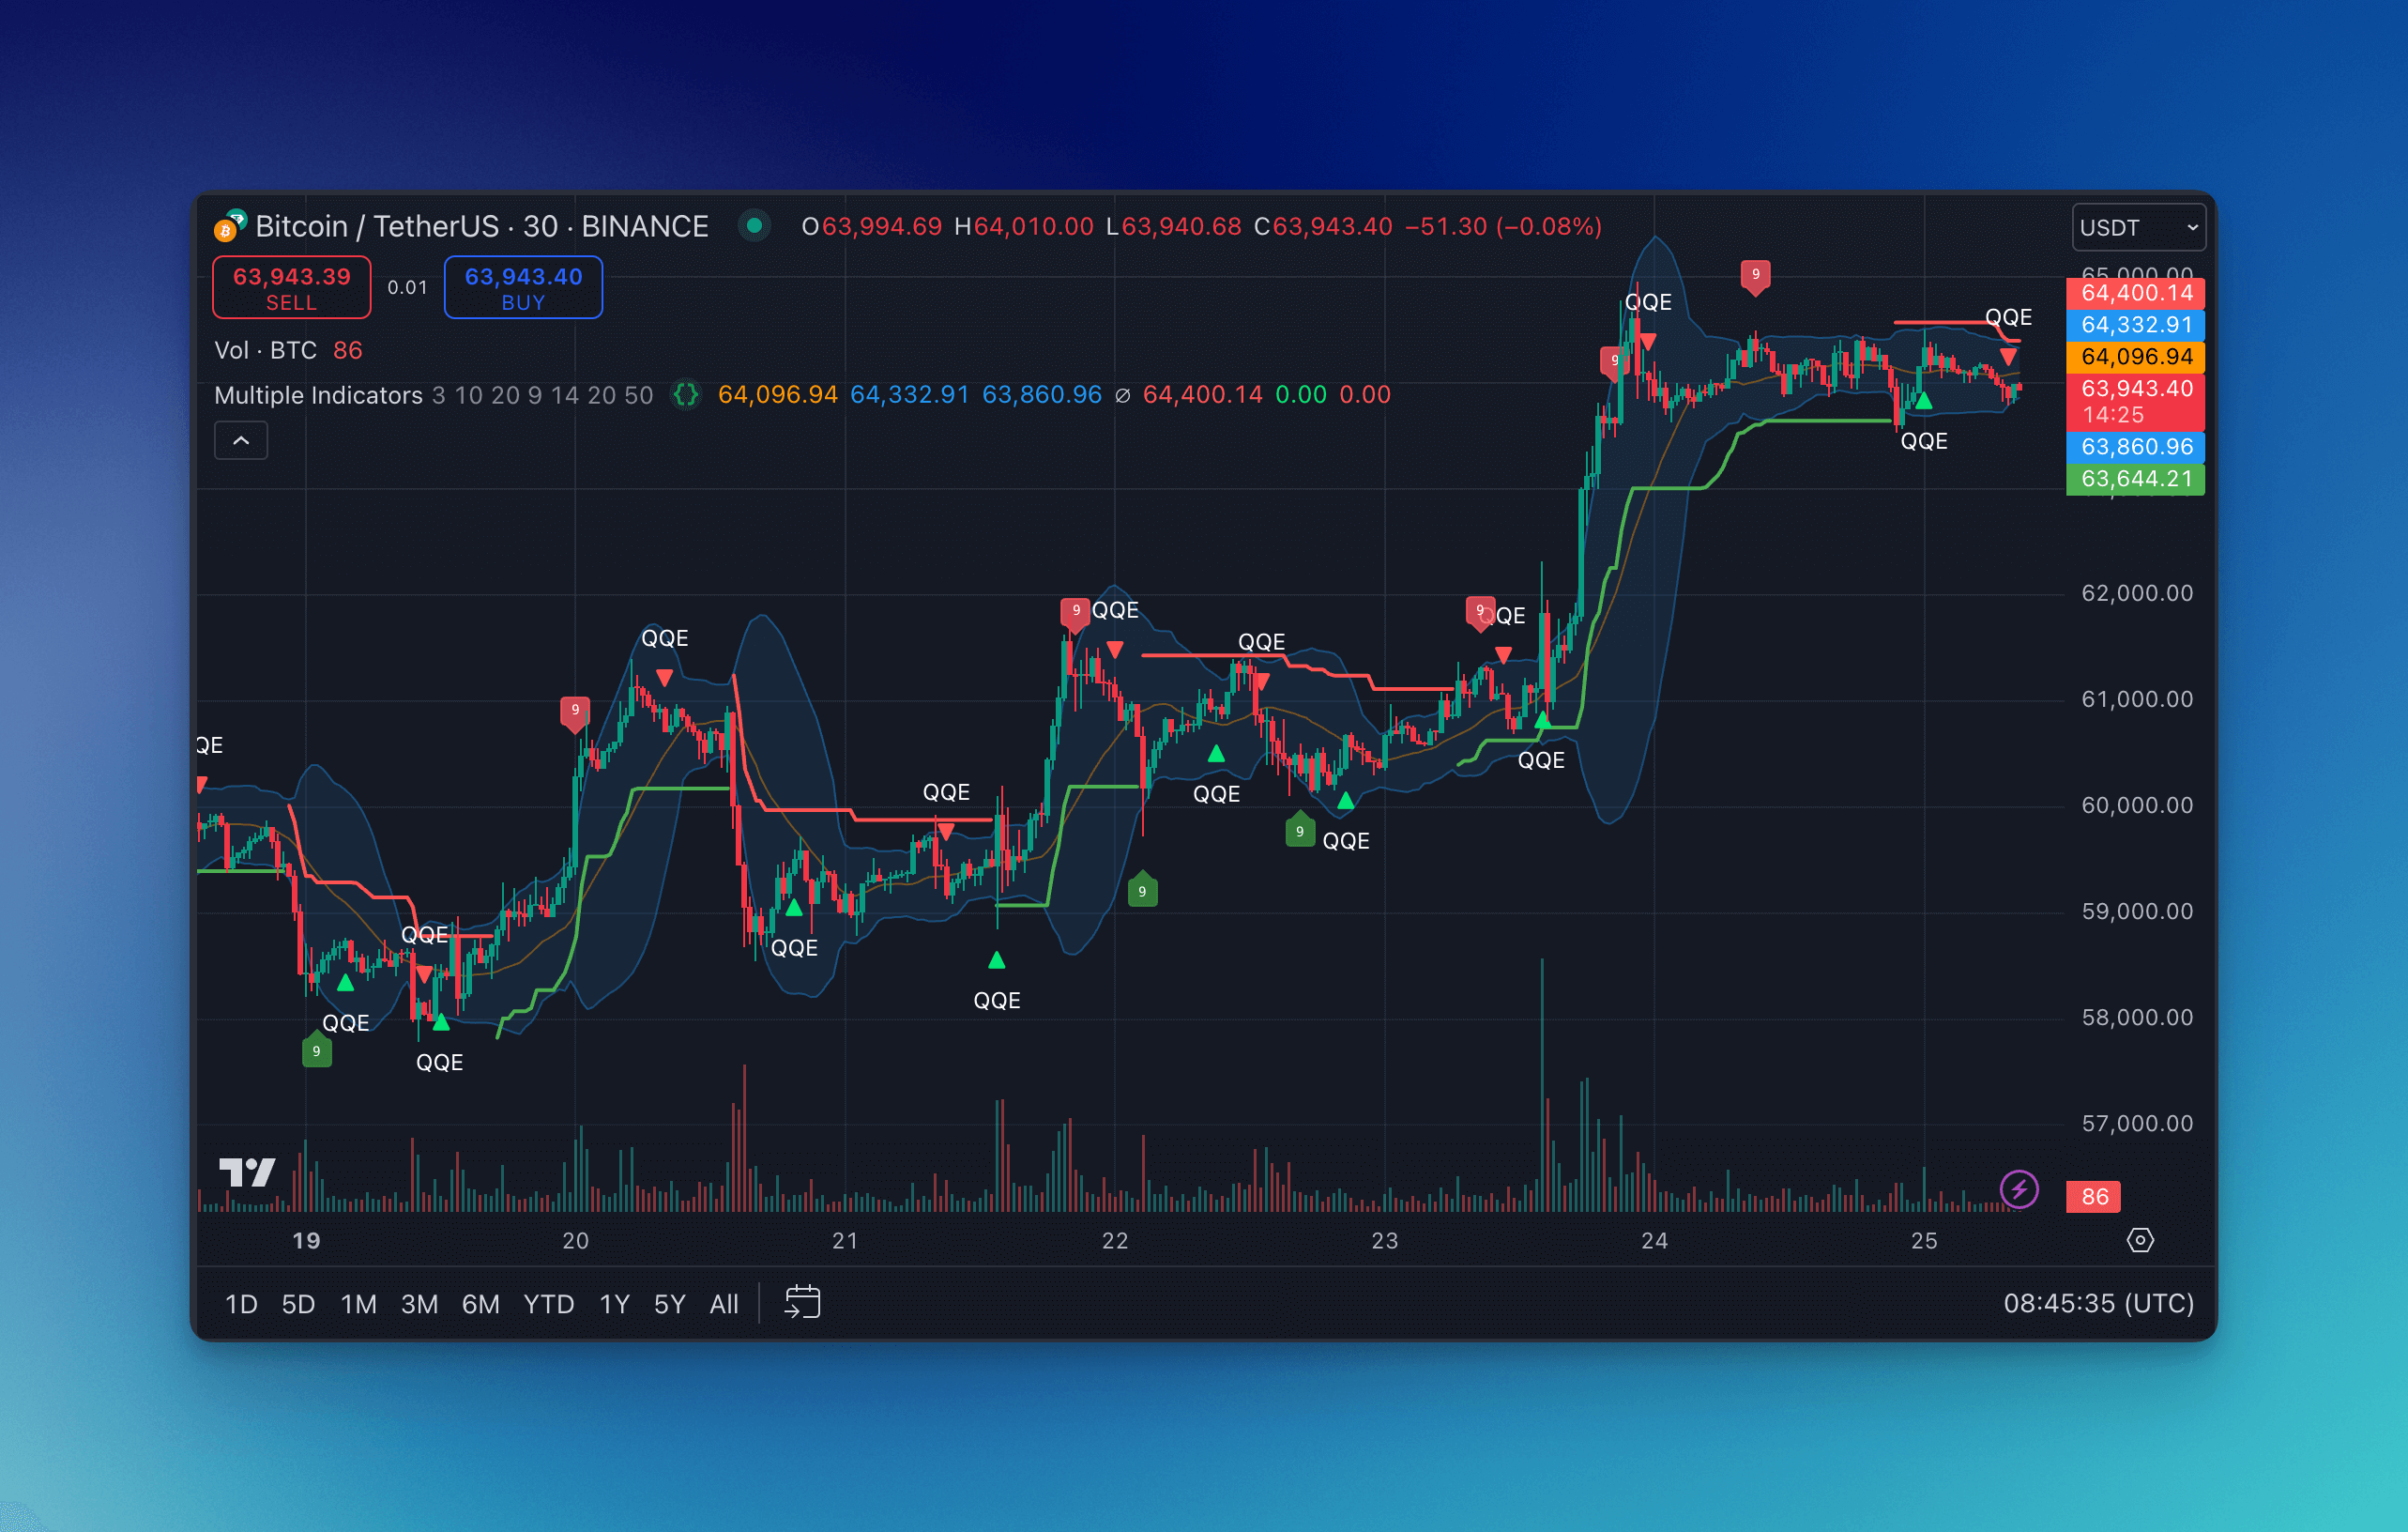
While every indicator comes with thoughtful default colors and styles, you'll probably want to customize the appearance to match your trading style and make important signals more prominent. Each indicator offers complete visual control - line colors, thickness, plot styles, and more.
What's really powerful is the ability to add custom plots for specific trading signals or conditions. Whether you want to highlight crossovers, breakouts, or custom trading rules, you can build these visual cues directly into your indicator. It's like creating a personalized trading dashboard that shows exactly what matters to your strategy.
Just like with the parameter inputs, all visual customization happens within TradingView's interface. Once your indicator is loaded, you can adjust colors, line styles, and display options without touching any code:
Speaking of visual optimization, if you're serious about improving your trading setup, you might also want to explore the best chart colors for TradingView to reduce eye strain and improve pattern recognition.
Getting Started: Your 5-Minute Path to Unlimited Indicators
Ready to break free from the two-indicator limitation? Here's the straightforward process:
- Visit Pineify - start with their free trial to test everything out
- Build your indicator combination - use the visual editor to add and configure your desired indicators
- Generate your Pine Script - click "Copy Pine Script" to get your custom code
- Add to TradingView - paste the code into TradingView's Pine Editor and apply it to your chart
That's literally it. No complex setup, no immediate subscription pressure, and absolutely no coding required on your part.
The entire process typically takes about 5 minutes once you're familiar with the interface. The result? Charts that rival premium setups, with all the indicators you actually need for proper technical analysis.
Why This Approach Makes Perfect Sense
Traditional premium plans can cost $15-60+ per month just to get more indicators. This method gives you unlimited indicator combinations for a fraction of that cost, plus you're learning valuable skills about how indicators work together.
If you're interested in expanding your trading toolkit even further, consider exploring the best free TradingView indicators that complement this multi-indicator approach, or learn about automated trading strategies that can work alongside your enhanced charting setup.
The Bottom Line
The two-indicator limit doesn't have to limit your analysis. By combining indicators into custom Pine Scripts, you get professional-level charting capabilities without the premium price tag. It's a legitimate, sustainable solution that actually improves your understanding of how different indicators work together.
Start simple with 3-4 indicators you already understand, then gradually build more complex combinations as you gain experience. Your trading analysis will never be the same.