How to Organize Your TradingView Indicators and Strategies Like a Pro
Look, I get it. You've probably been there—staring at a cluttered mess of indicators scattered across your TradingView workspace, trying to remember which RSI variation you coded last month or where you saved that Bollinger Bands strategy that was working so well.
Here's the thing: having great indicators is only half the battle. The other half? Actually being able to find and use them when you need them. That's where proper organization comes in, and trust me, it's a game-changer.
Why Most Traders Fail at Organization (And How to Fix It)
Most traders treat their indicator collection like that junk drawer everyone has—throw everything in and hope for the best. But when you're trying to make split-second trading decisions, you can't afford to waste time hunting through dozens of scripts.
The solution is simple: create a system that actually works. And the best part? Once you set it up, maintaining it takes maybe 30 seconds per new indicator.
Your Indicator Command Center: Making Sense of the Chaos
On the Home Page of Pineify, you get what I like to call your "trading command center." It's designed like your brain actually works—lists on the left, details on the right, everything visible at a glance.
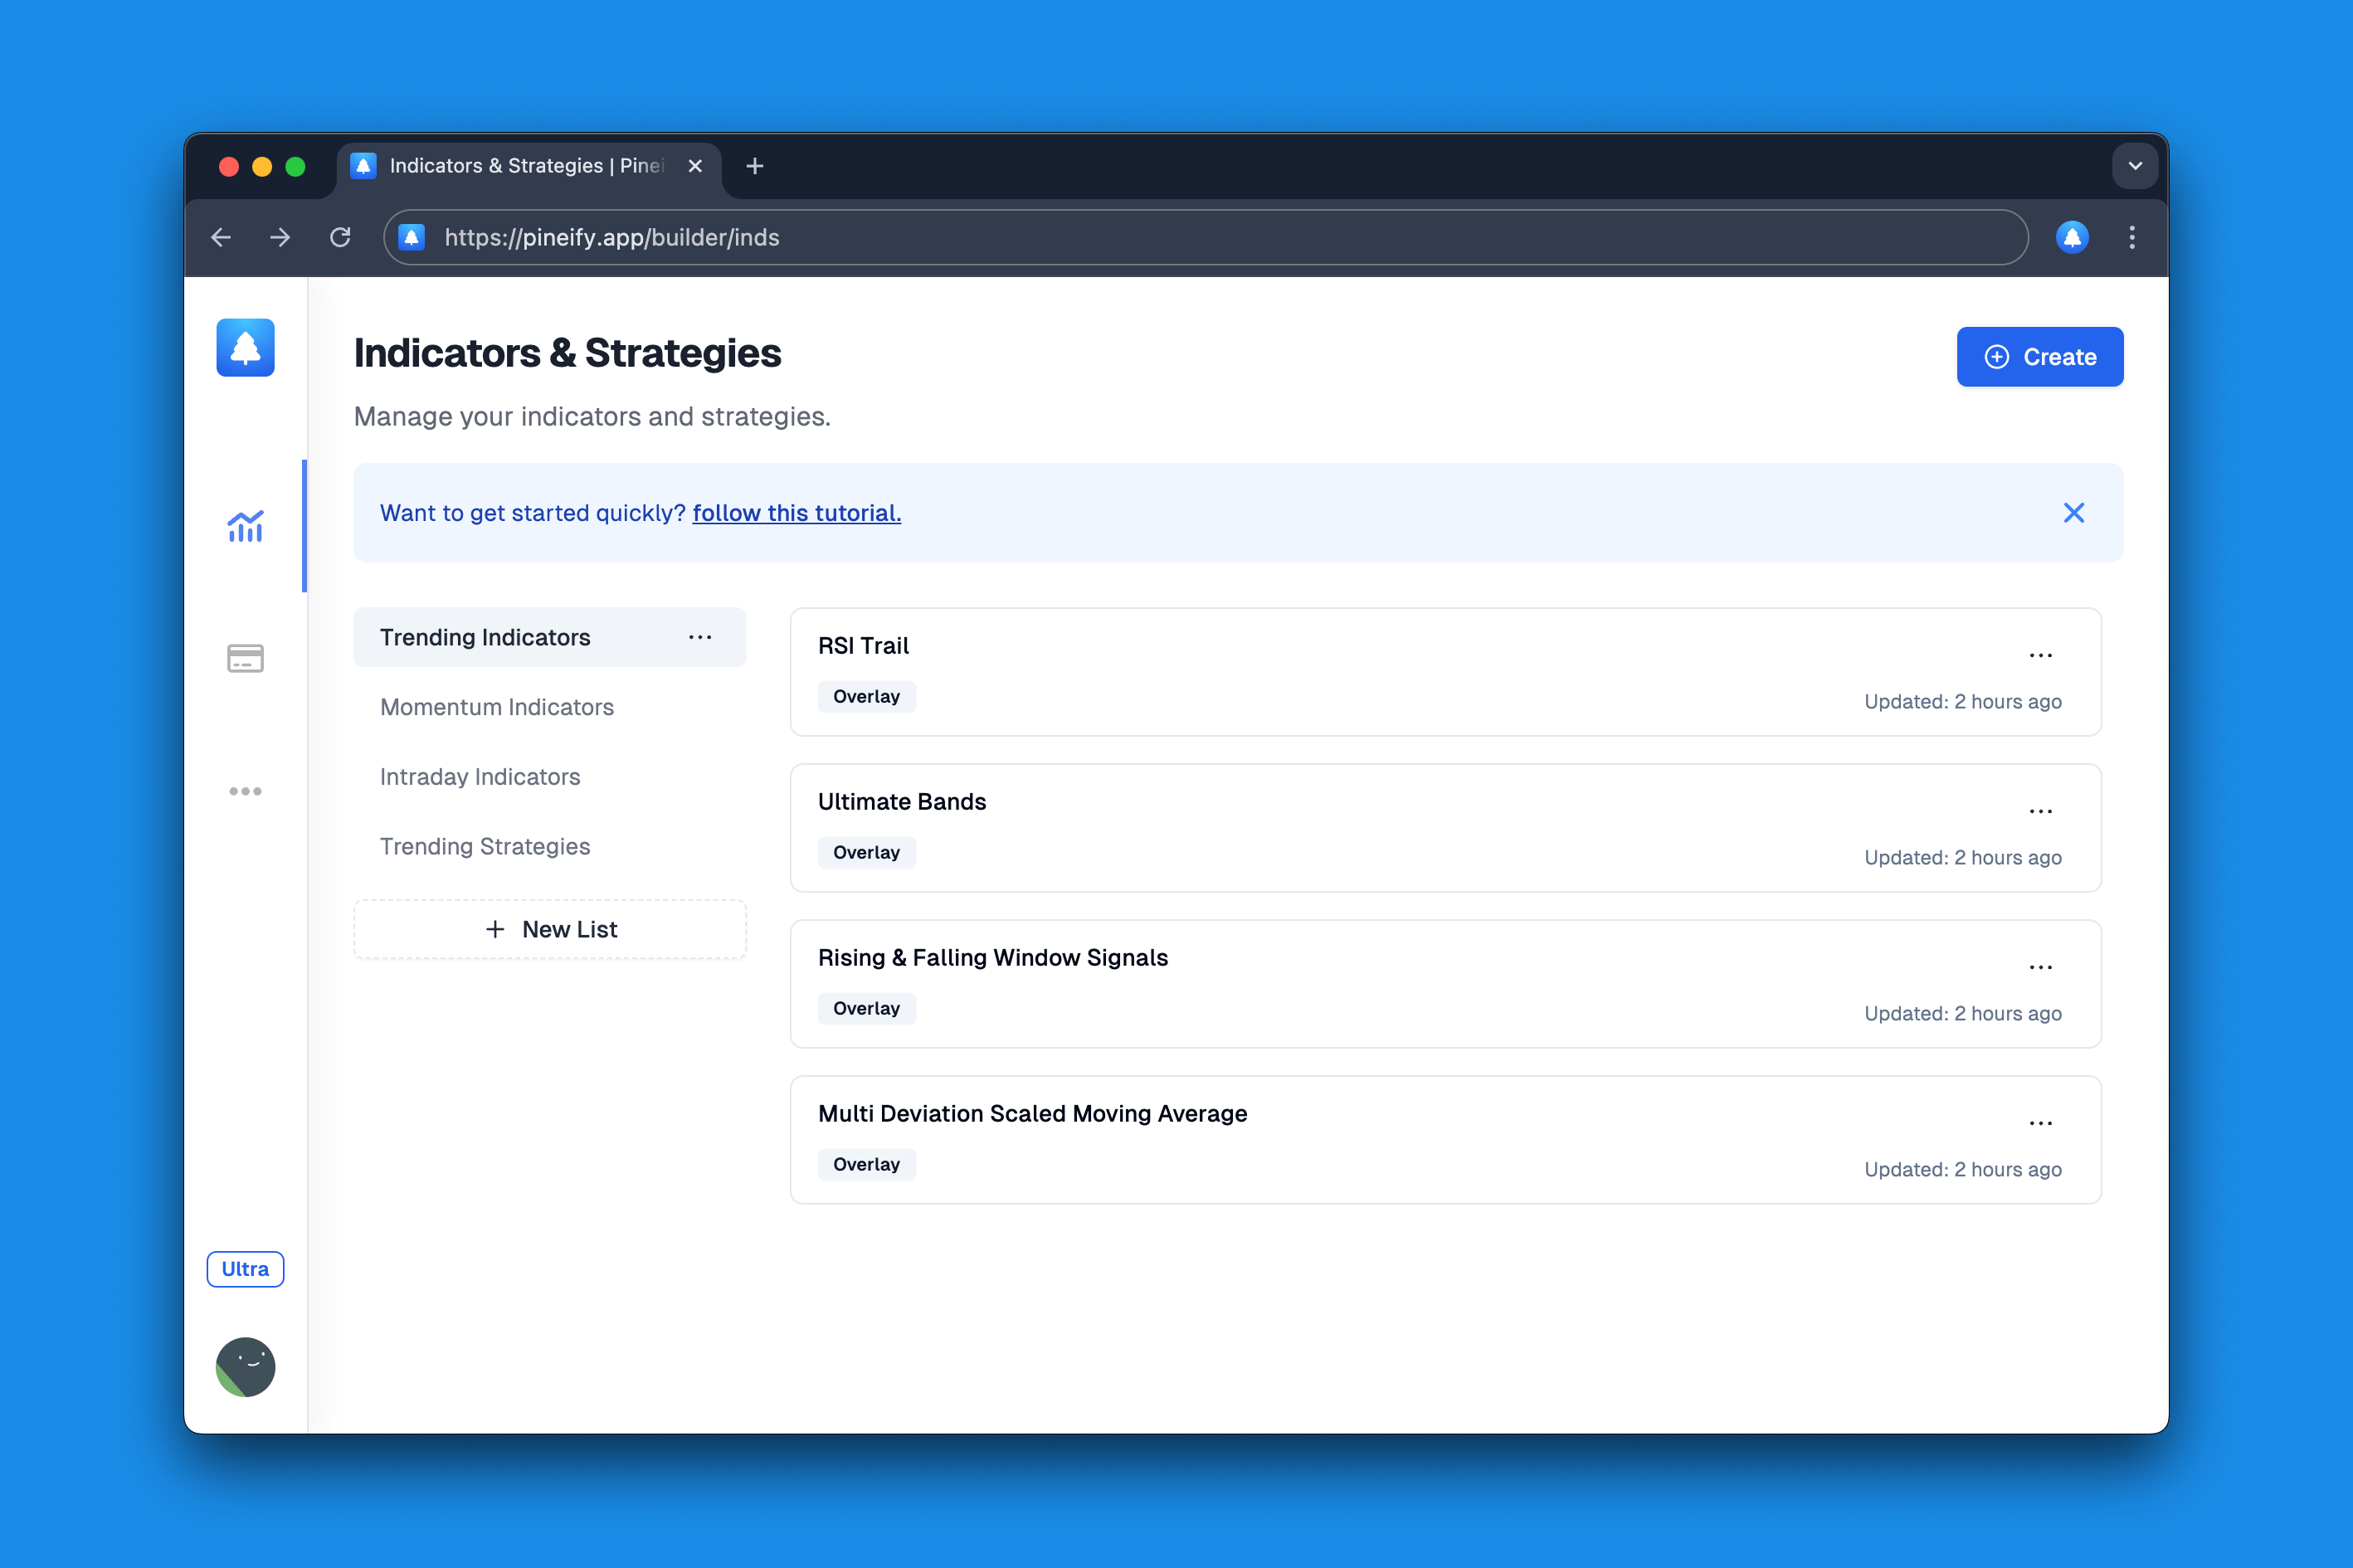
Here's what makes this setup brilliant: you can create unlimited strategies under each list. So whether you're into day trading indicators or building long-term trend-following systems, everything has its place.
Think of it like organizing your music library—you wouldn't dump all your songs in one folder, right? Same principle applies here.
Creating Your First Indicator (The Right Way)
Here's where most people mess up: they jump straight into coding without thinking about organization. Don't be that person.
When you click the create button (it's in the upper right corner), you'll see this dialog:
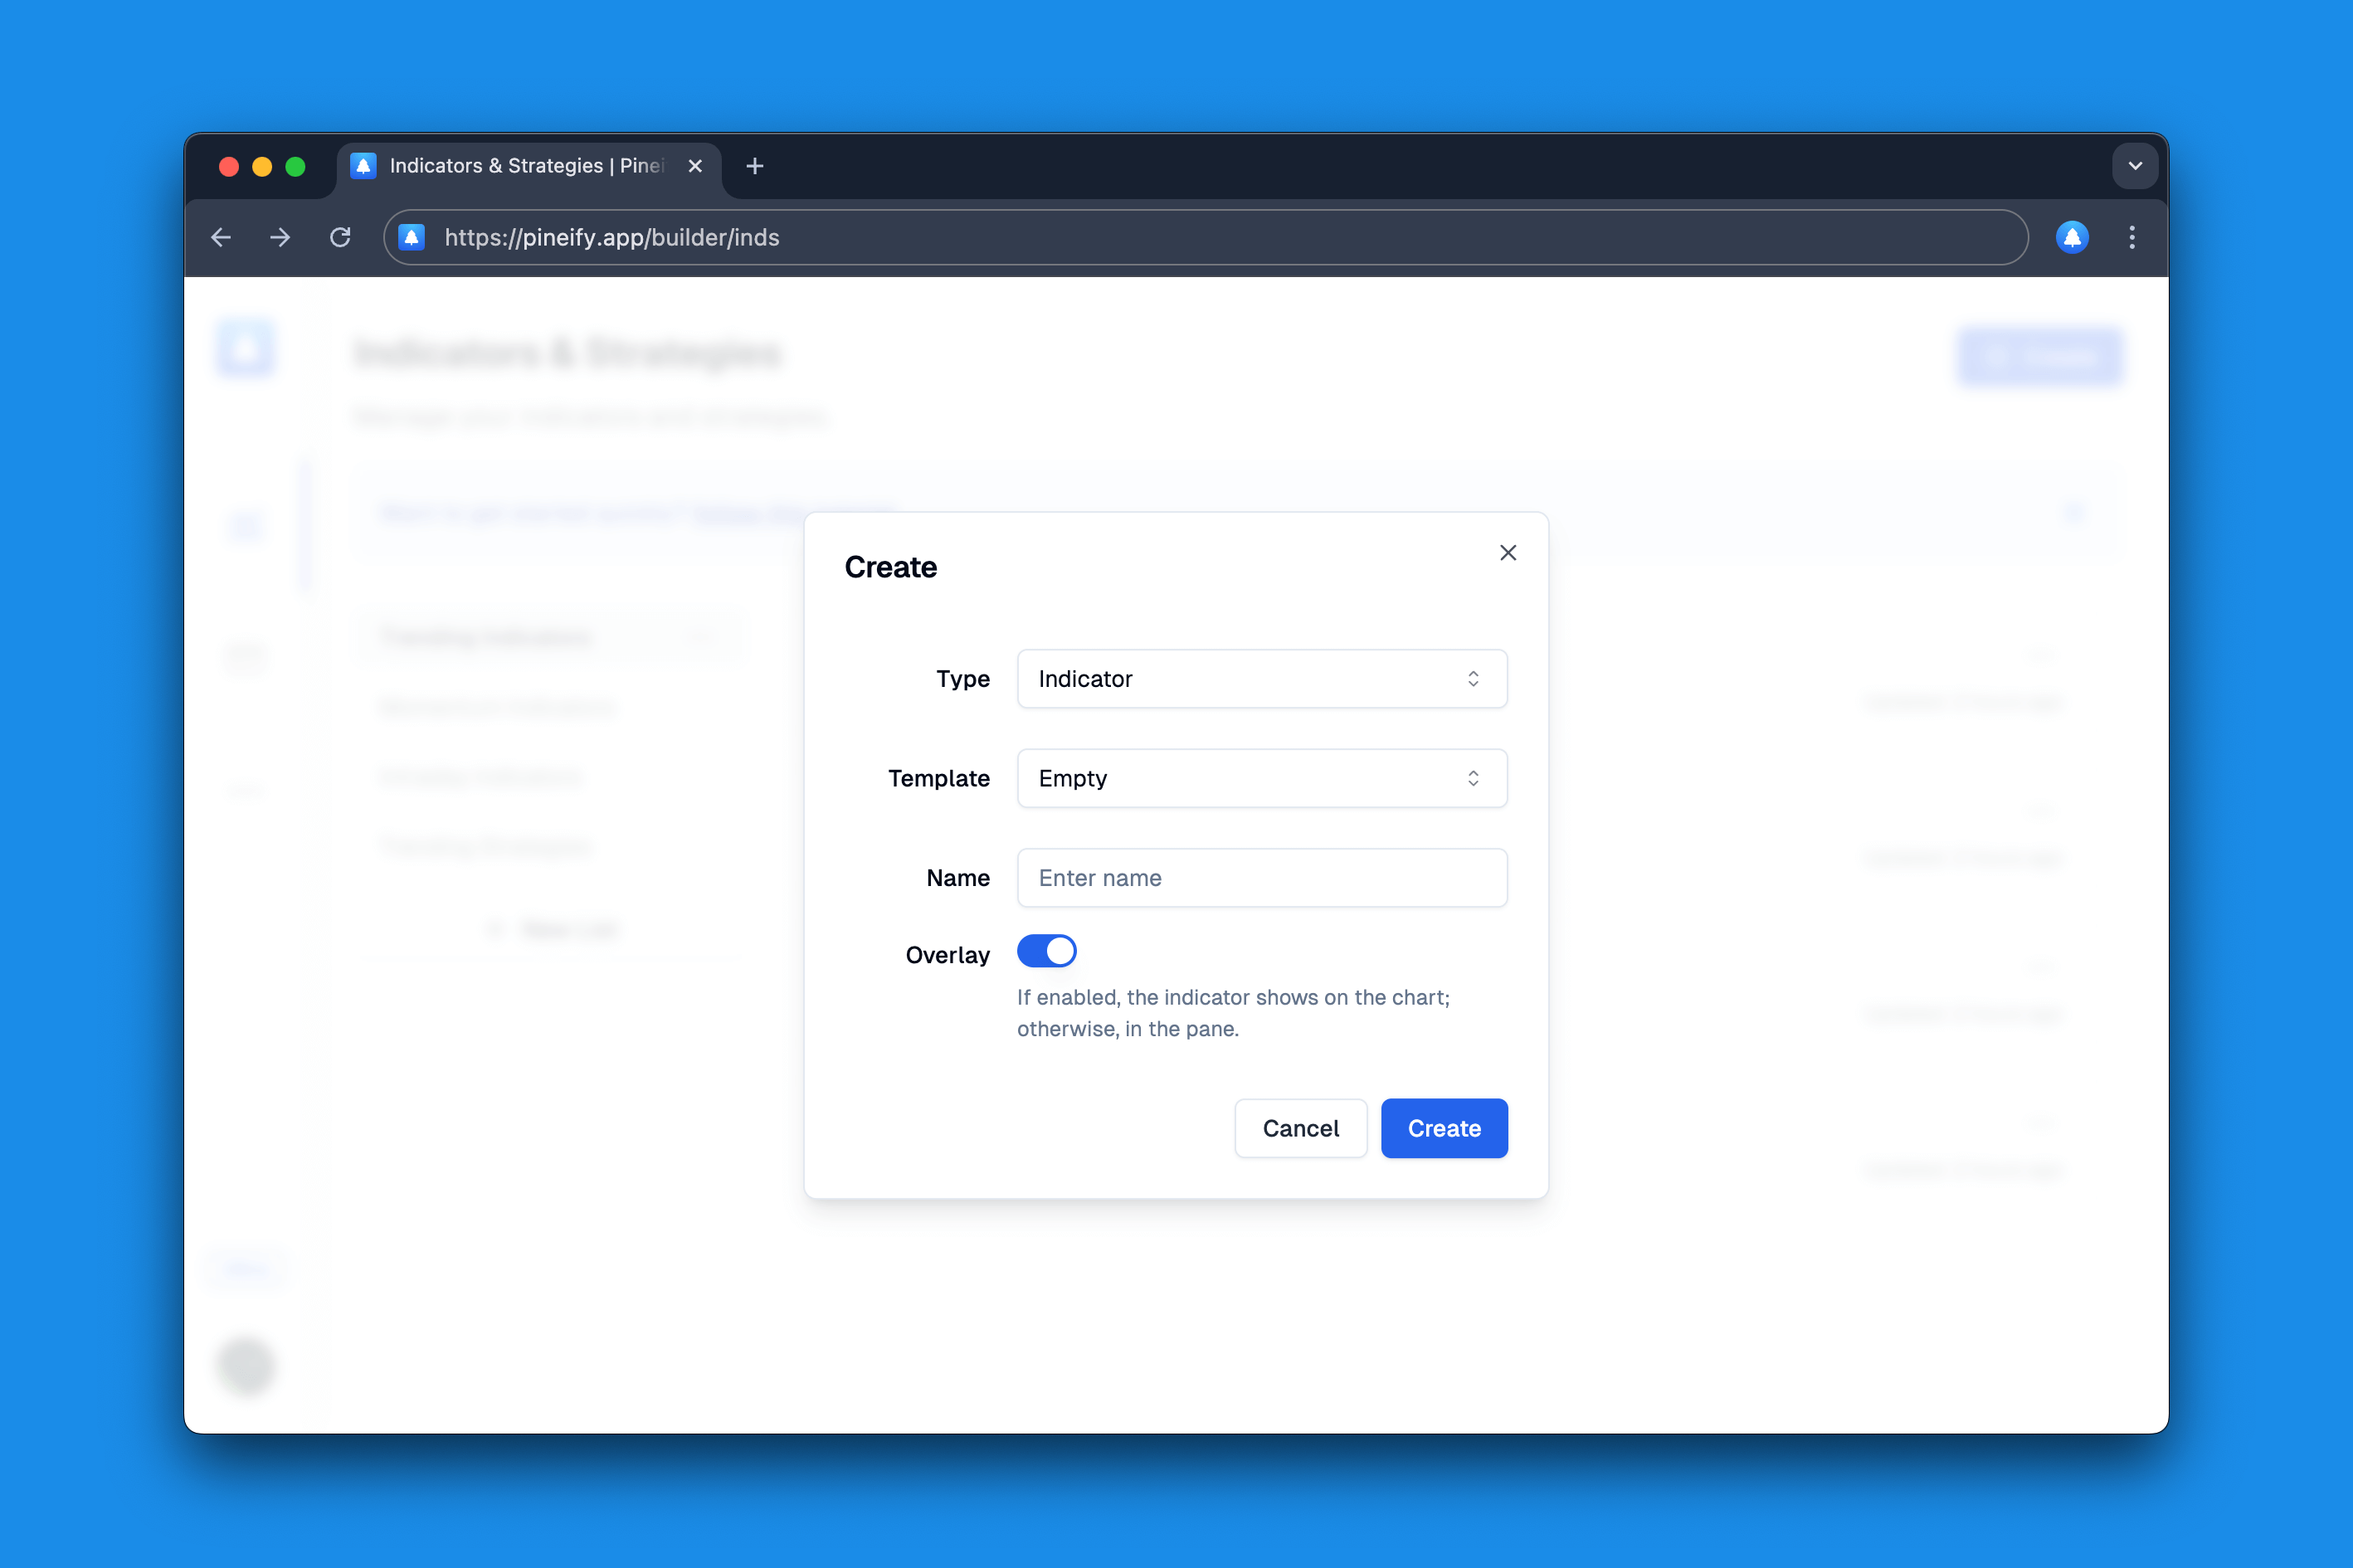
"Indicator" is selected by default, which saves you a click. But here's the key—give your indicator a name that actually means something. "RSI Test 3" isn't helpful. "RSI Divergence Scanner - 15min Scalping" tells you exactly what it does and when to use it.
The Two Settings That Actually Matter
Template: Start with an empty template unless you're building on something specific. If you're creating variations of existing indicators (like a custom MACD crossover), then using a template makes sense.
Overlay: This is where beginners get confused. Here's the simple rule: if your indicator shows price levels (like moving averages or Bollinger Bands), keep overlay ON. If it's showing momentum or oscillators (like RSI or MACD), turn overlay OFF so it appears in a separate pane.
Building Trading Strategies That Don't Suck
Strategies are different beasts. They're not just about pretty lines on charts—they're about making (or losing) money. So the organization matters even more.
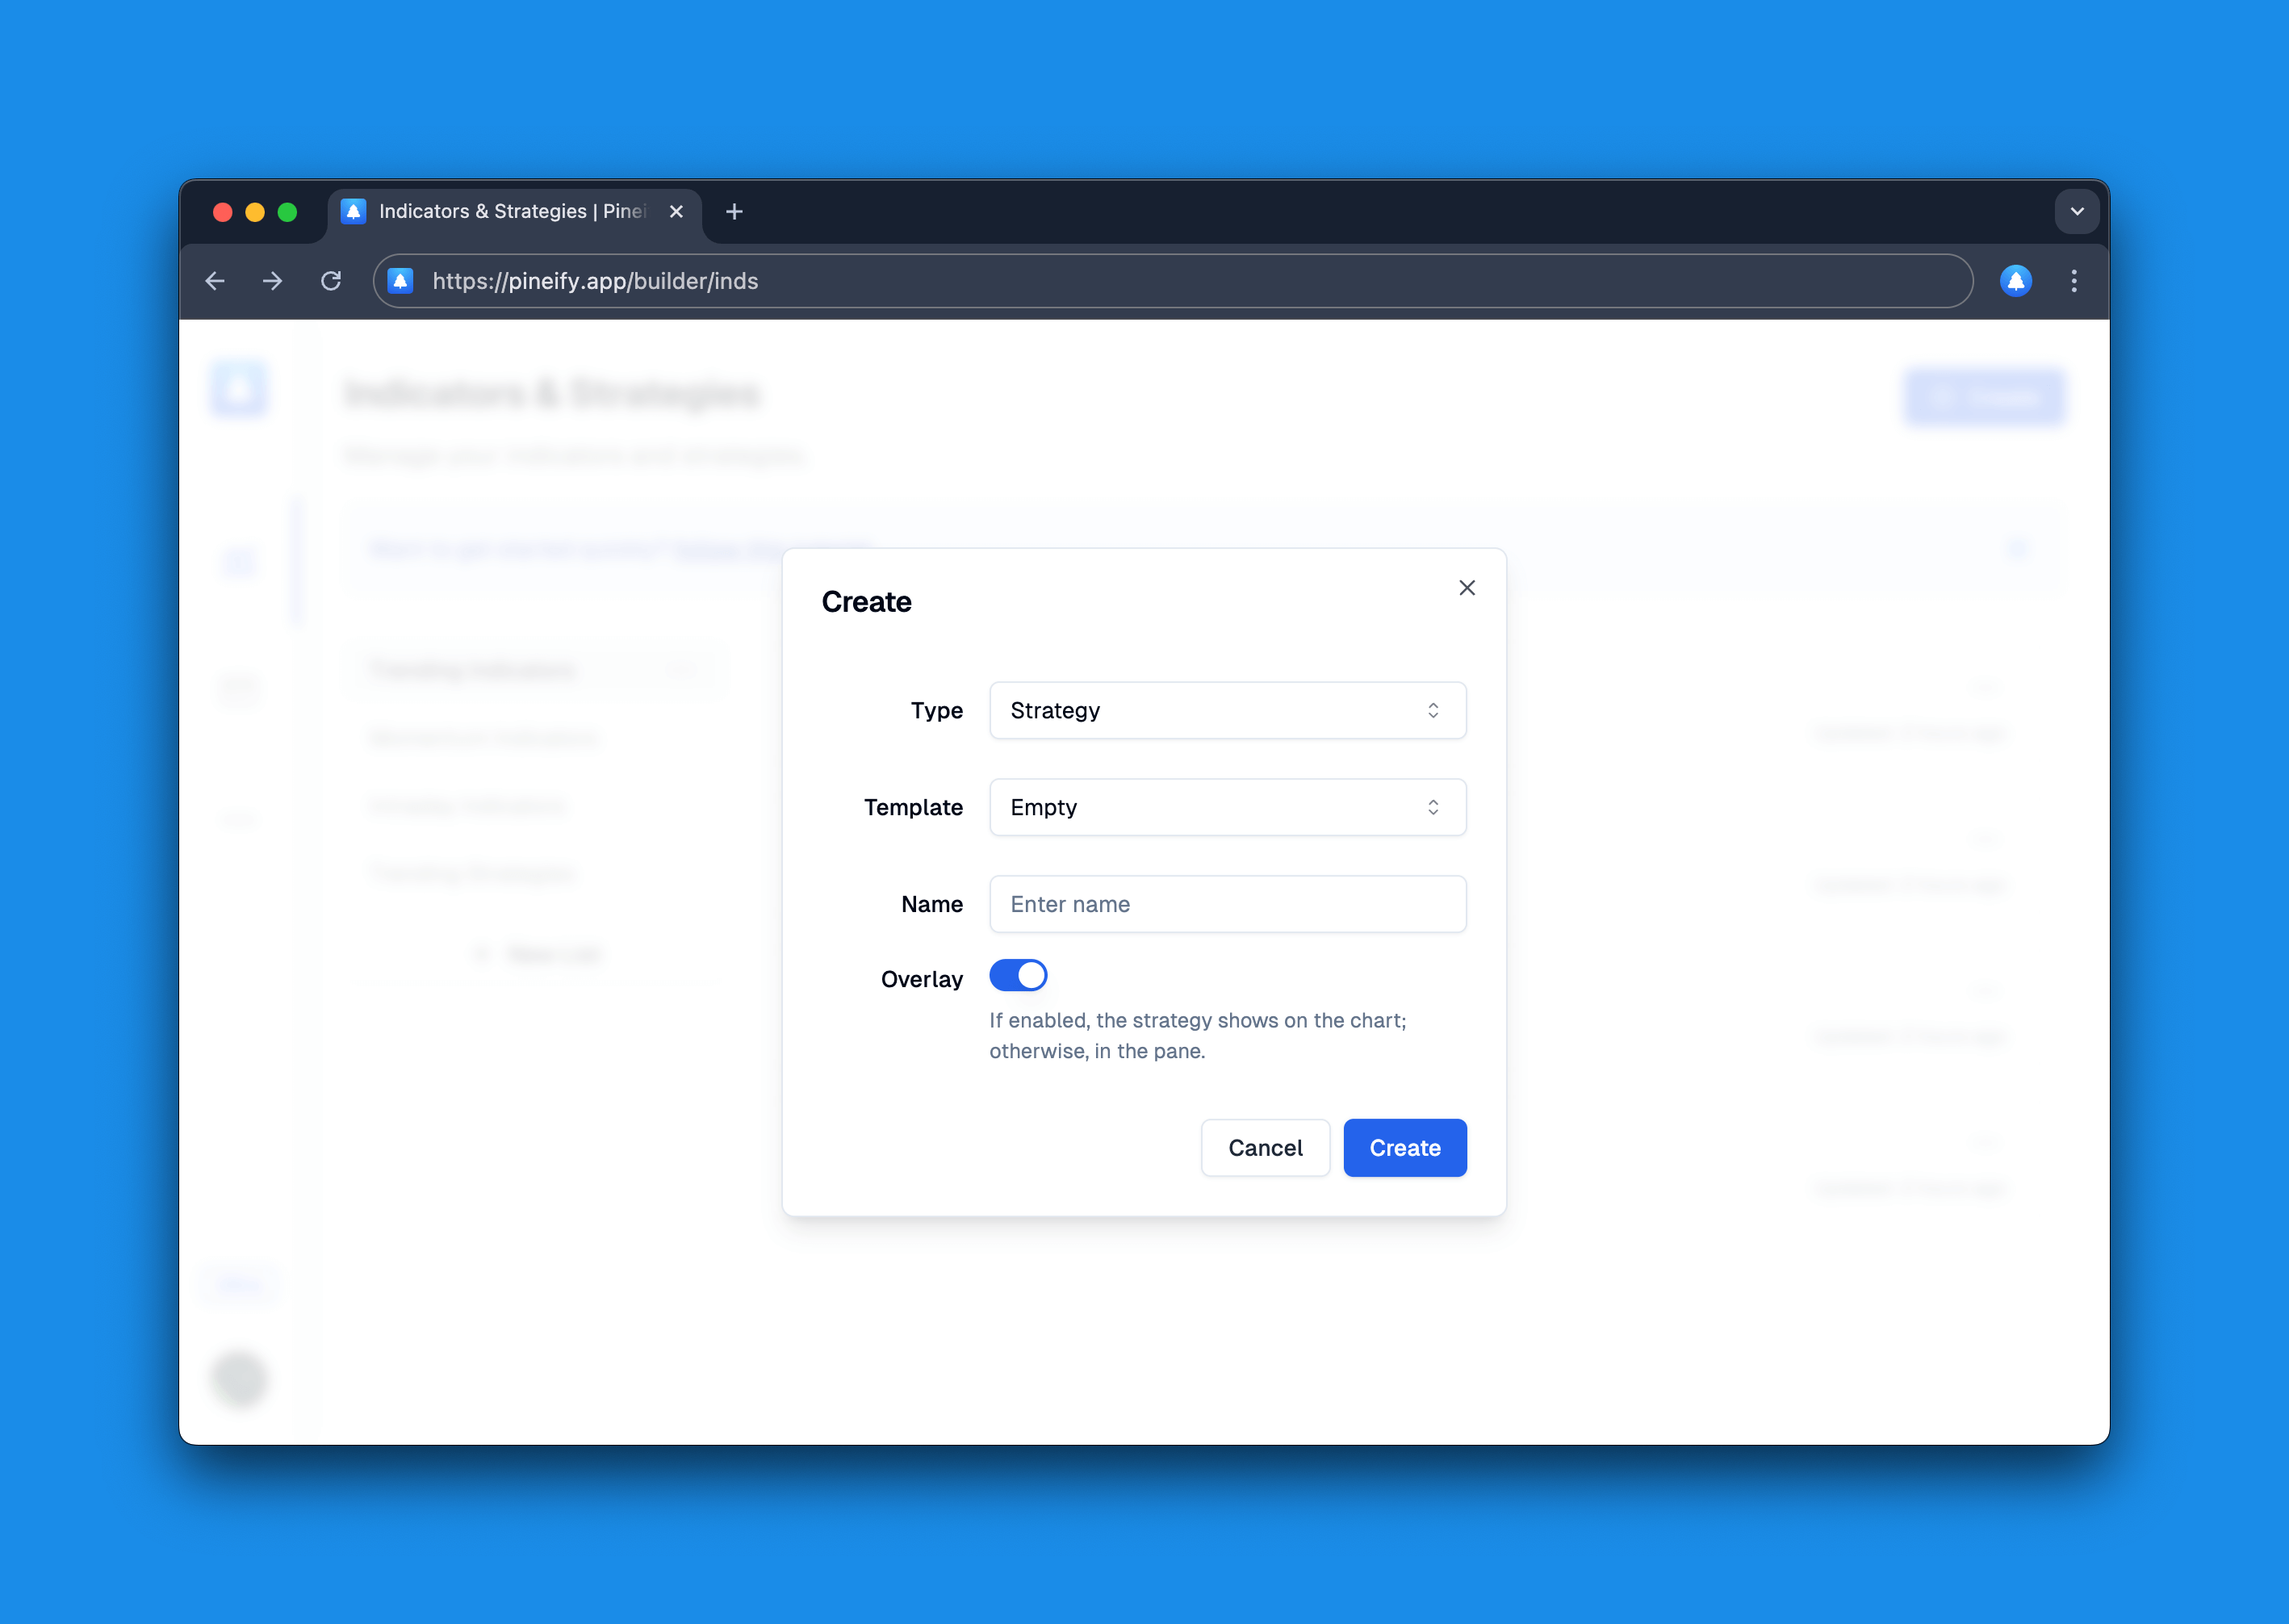
When creating strategies, I follow the same naming convention but add performance hints: "Breakout Strategy - EURUSD - 65% Win Rate" tells me everything I need to know at a glance.
Strategy Organization Pro Tips
-
Group by market: Keep your forex strategies separate from your crypto ones. Market behavior is different, and your strategies should reflect that.
-
Include timeframes in names: A 5-minute scalping strategy and a daily swing strategy shouldn't live in the same mental bucket.
-
Track what works: If you're serious about this, you need to know which strategies actually make money. Proper backtesting is crucial here.
The Secret to Long-Term Success: Maintenance
Here's what nobody tells you: the best organizational system in the world falls apart if you don't maintain it. But it's easier than you think.
Every time you create something new, ask yourself:
- What category does this belong in?
- Will I remember what this does in 6 months?
- Is this actually different from something I already have?
That last point is huge. I see traders with 47 different RSI variations that basically do the same thing. Don't be that person.
Making It All Work Together
The real magic happens when you start combining indicators intelligently. Maybe you use a moving average ribbon for trend direction and layer in some volume analysis for confirmation.
But here's the catch: you need to be able to find these tools quickly when market conditions change. That's where good organization pays off—no more scrolling through endless lists while a perfect setup slips away.
Your Next Steps
Start simple. Pick one category (maybe "Trend Following" or "Momentum Oscillators") and organize just those indicators first. Get comfortable with the system, then expand.
And remember—the goal isn't to have the most indicators. It's to have the right indicators, organized in a way that actually helps your trading. Quality over quantity, always.
The best traders I know use maybe 10-15 core indicators, but they know those tools inside and out. They can access them instantly, modify them quickly, and combine them effectively. That's the level you want to reach.
Ready to clean up your trading workspace? Your future self (and your P&L) will thank you.