Create Your First Indicator
Next, we'll create an indicator to display the EMA and Supertrend indicators on the main chart, along with their respective buy and sell points and alerts.
Create an indicator
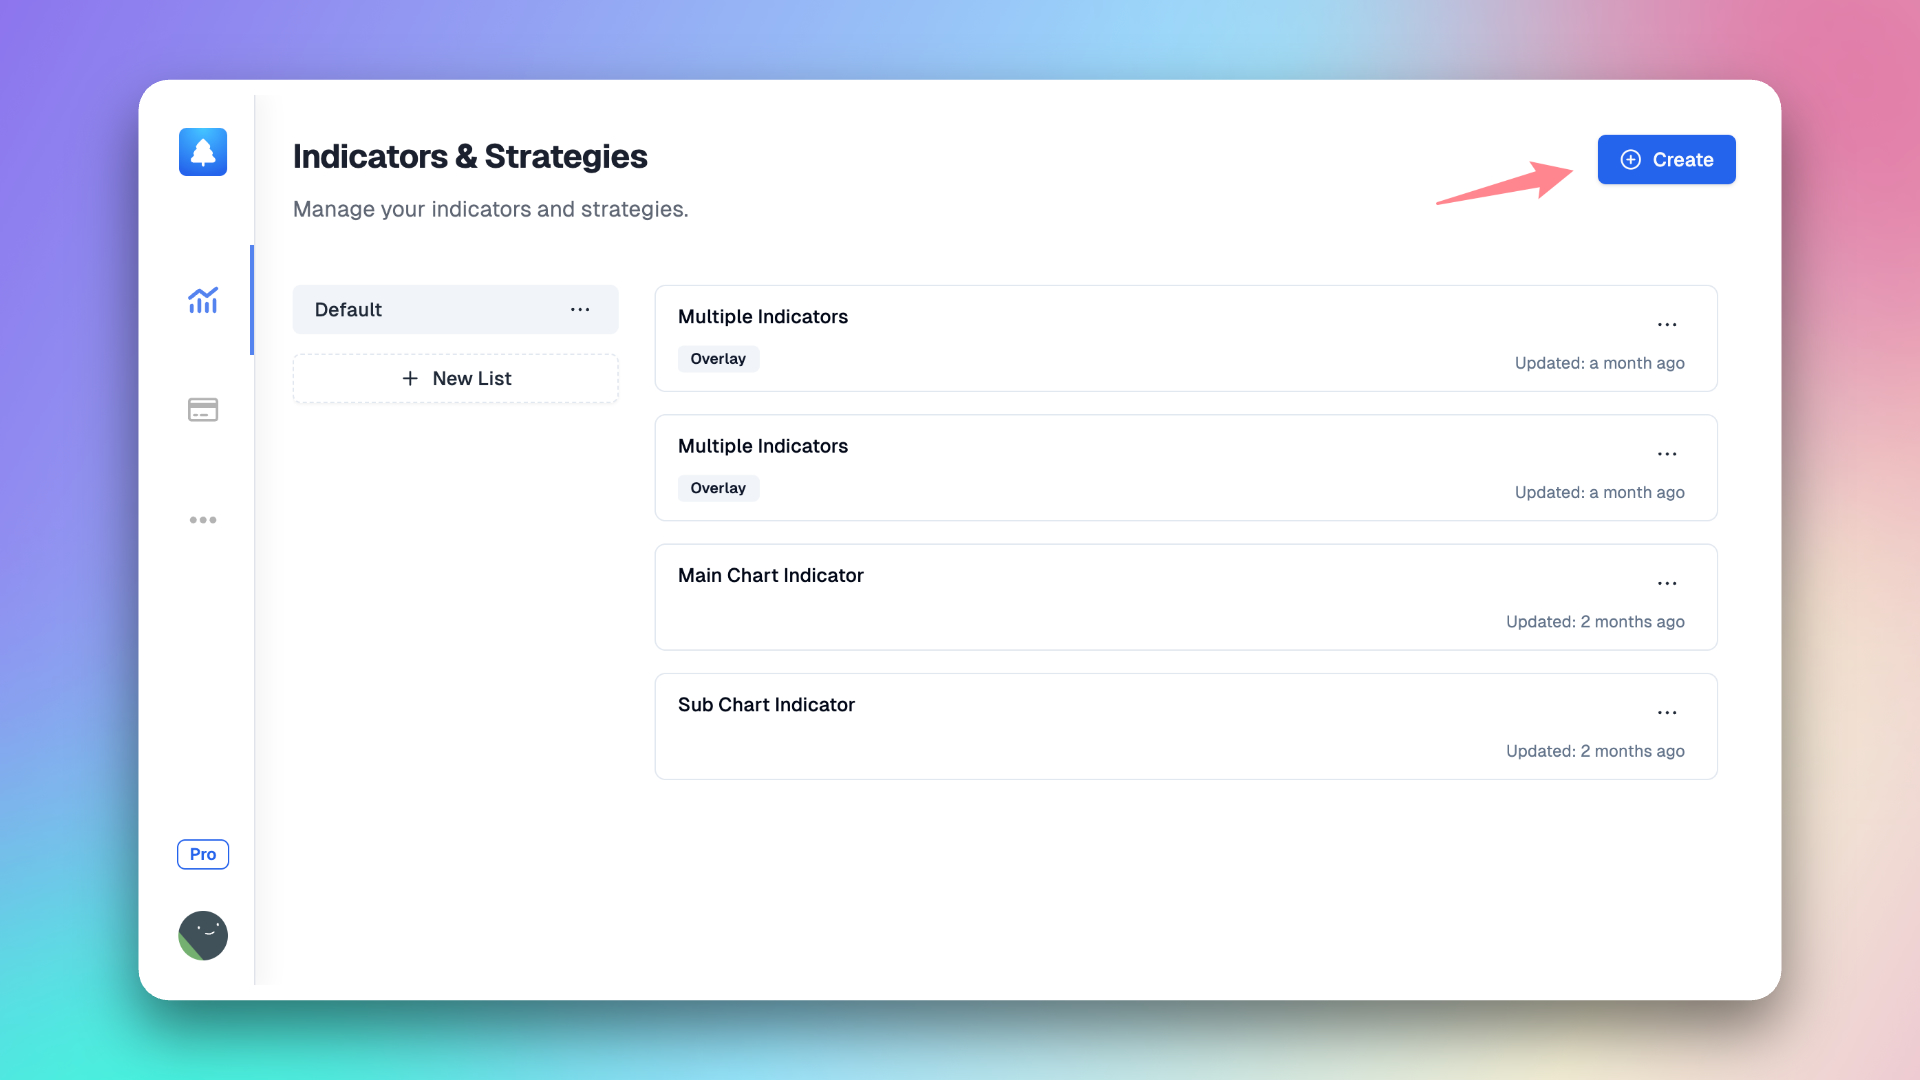
Open the Pineify Builder, click the "Create" button on the homepage. In the pop-up dialog box, you need to choose the type of indicator and then select the corresponding blank template in the subsequent options.
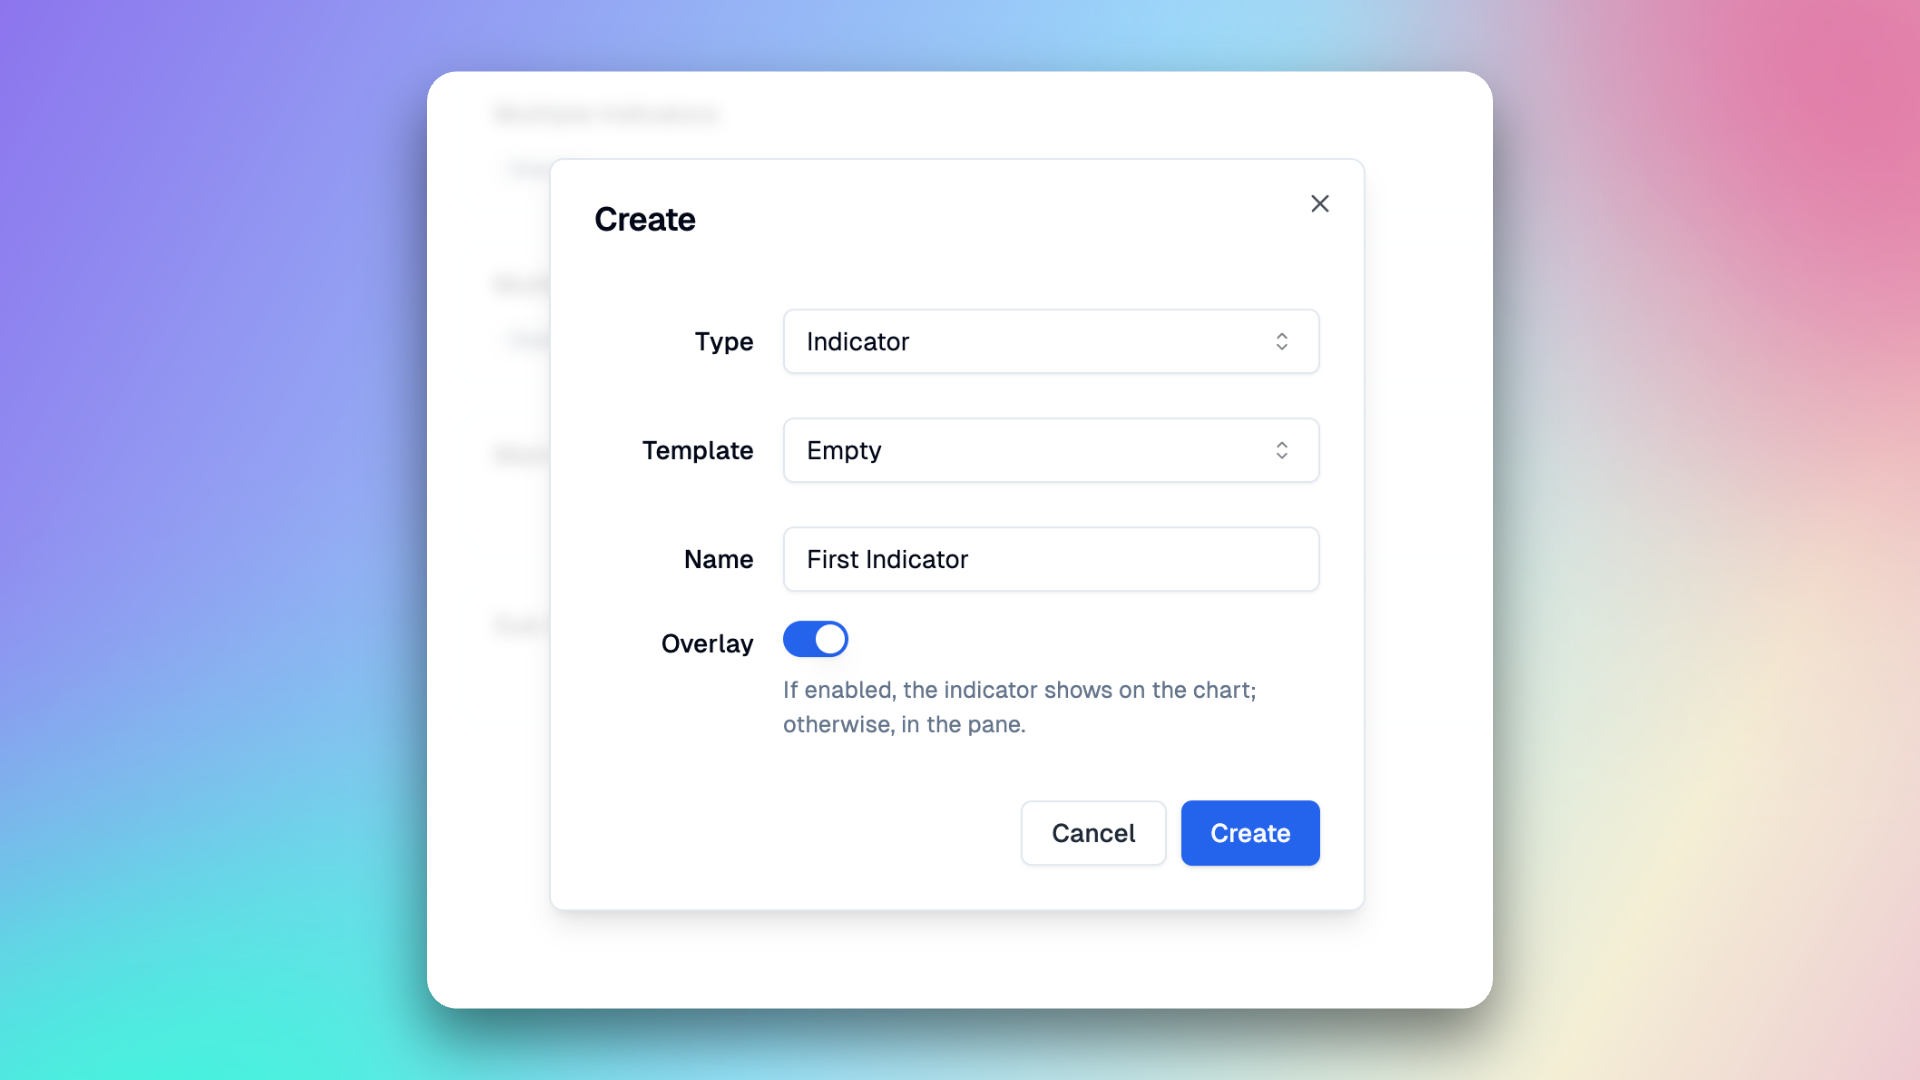
Now an empty indicator has been created, let's proceed step by step to build this indicator 🥳.
Add input
On the editor page, you can see Input Elements on the right. 13 input types are supported, as shown below.
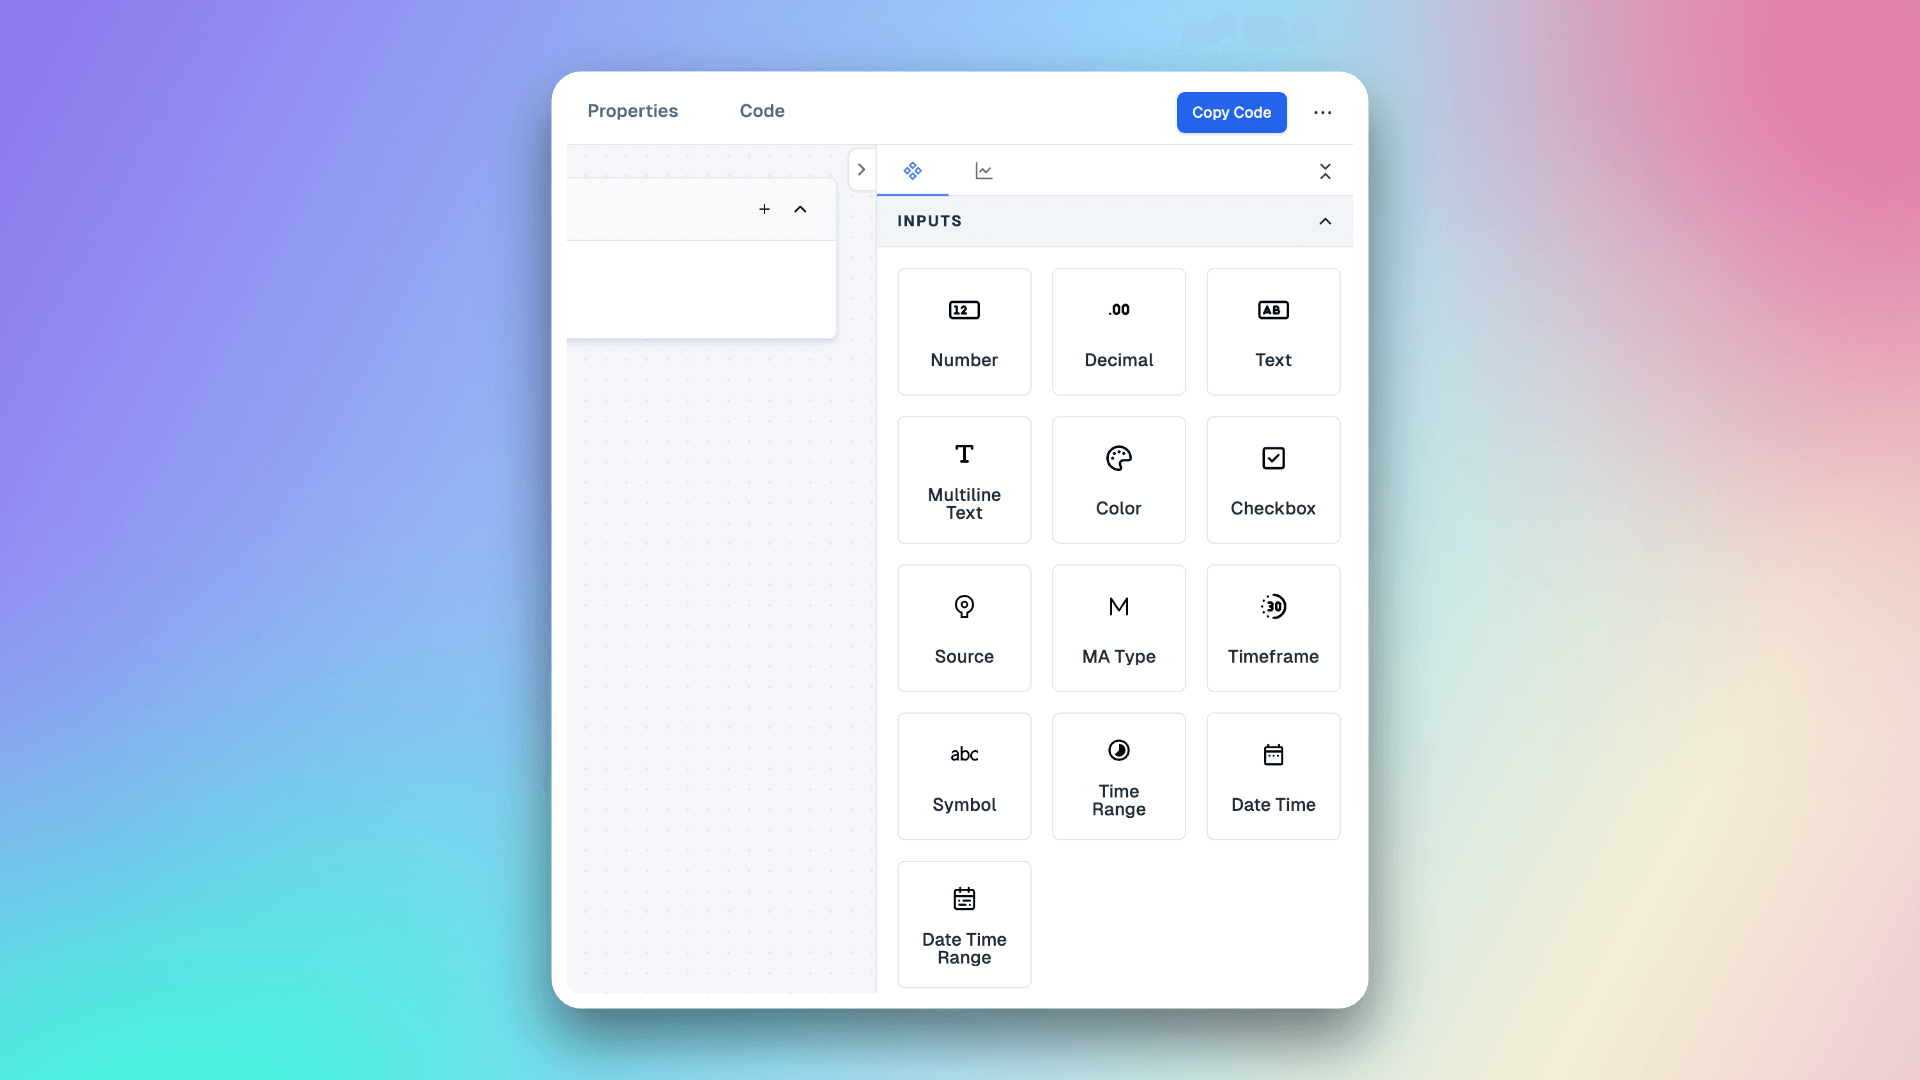
Inputs allow indicators to accept values that can be changed by the user and edited in the indicator settings, this will make it much easier to change parameters for your indicators and strategies in TradingView without having to edit any code.
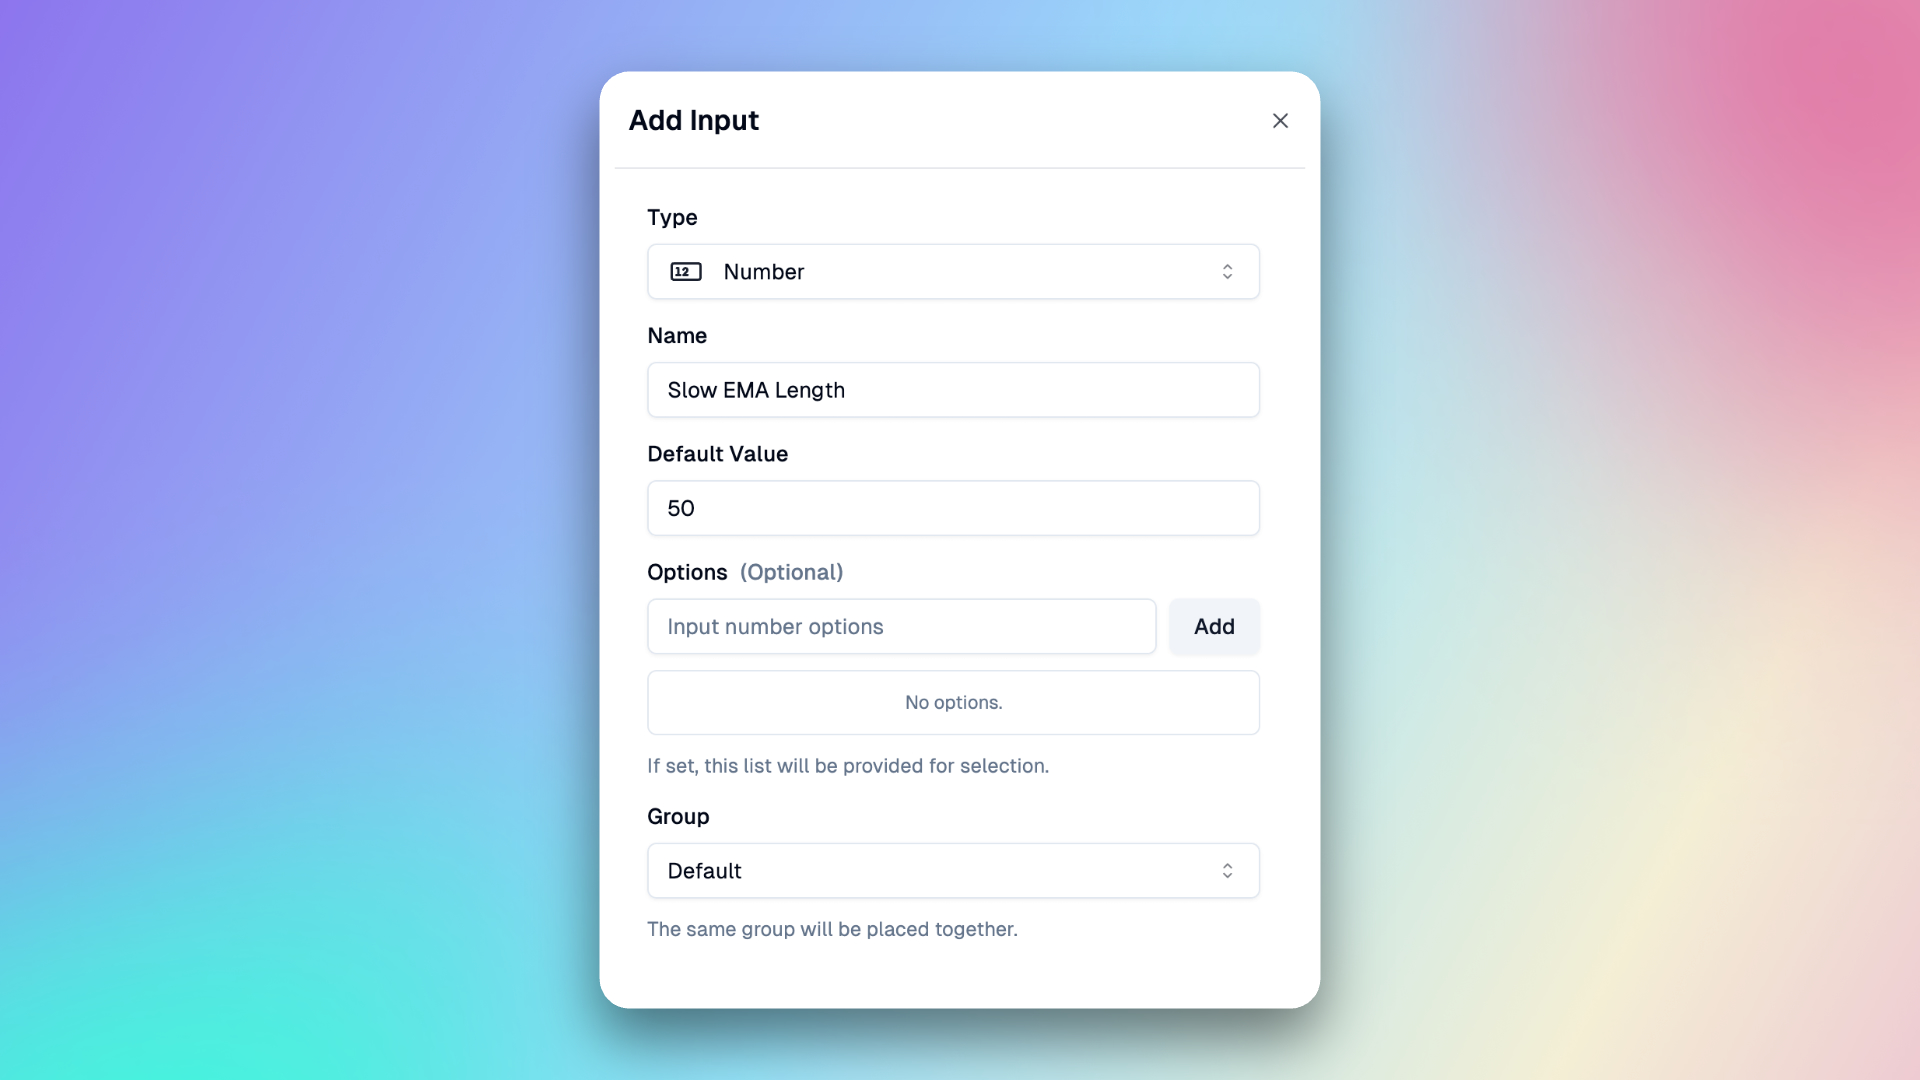
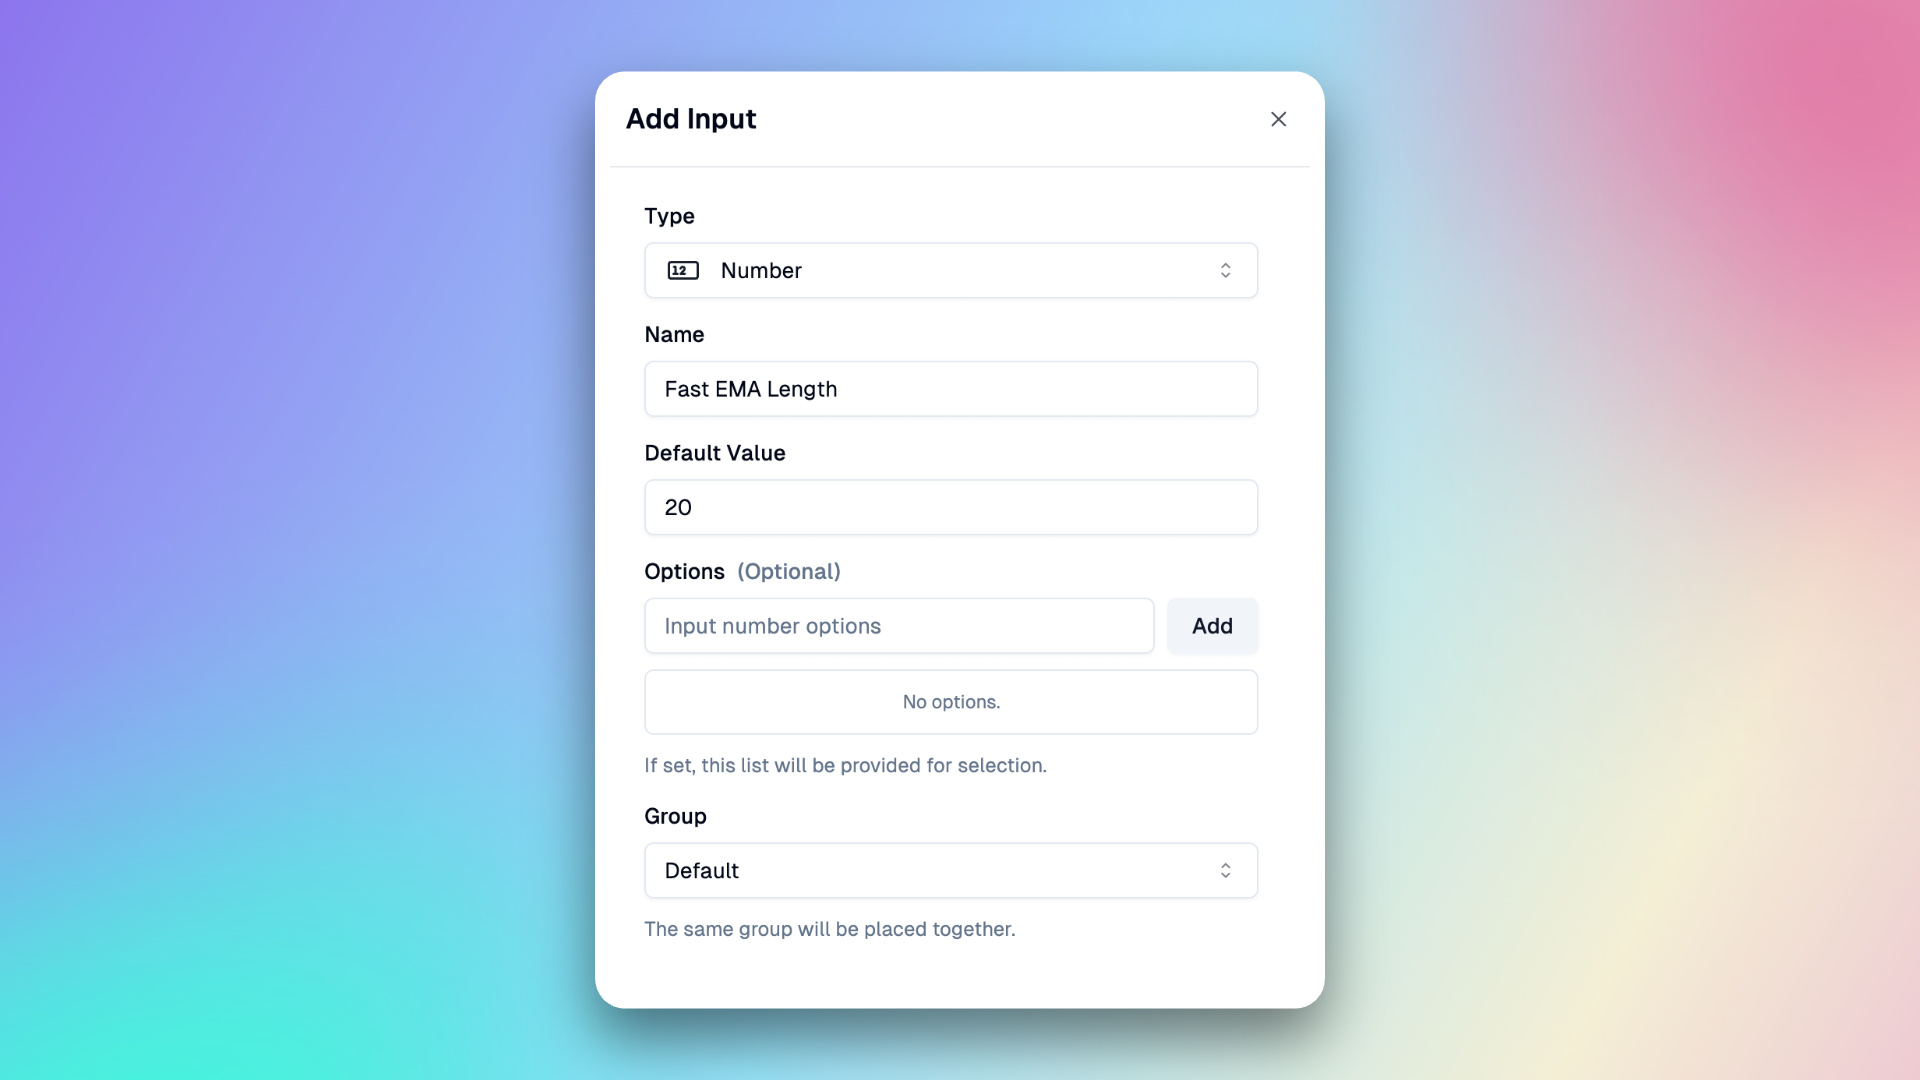
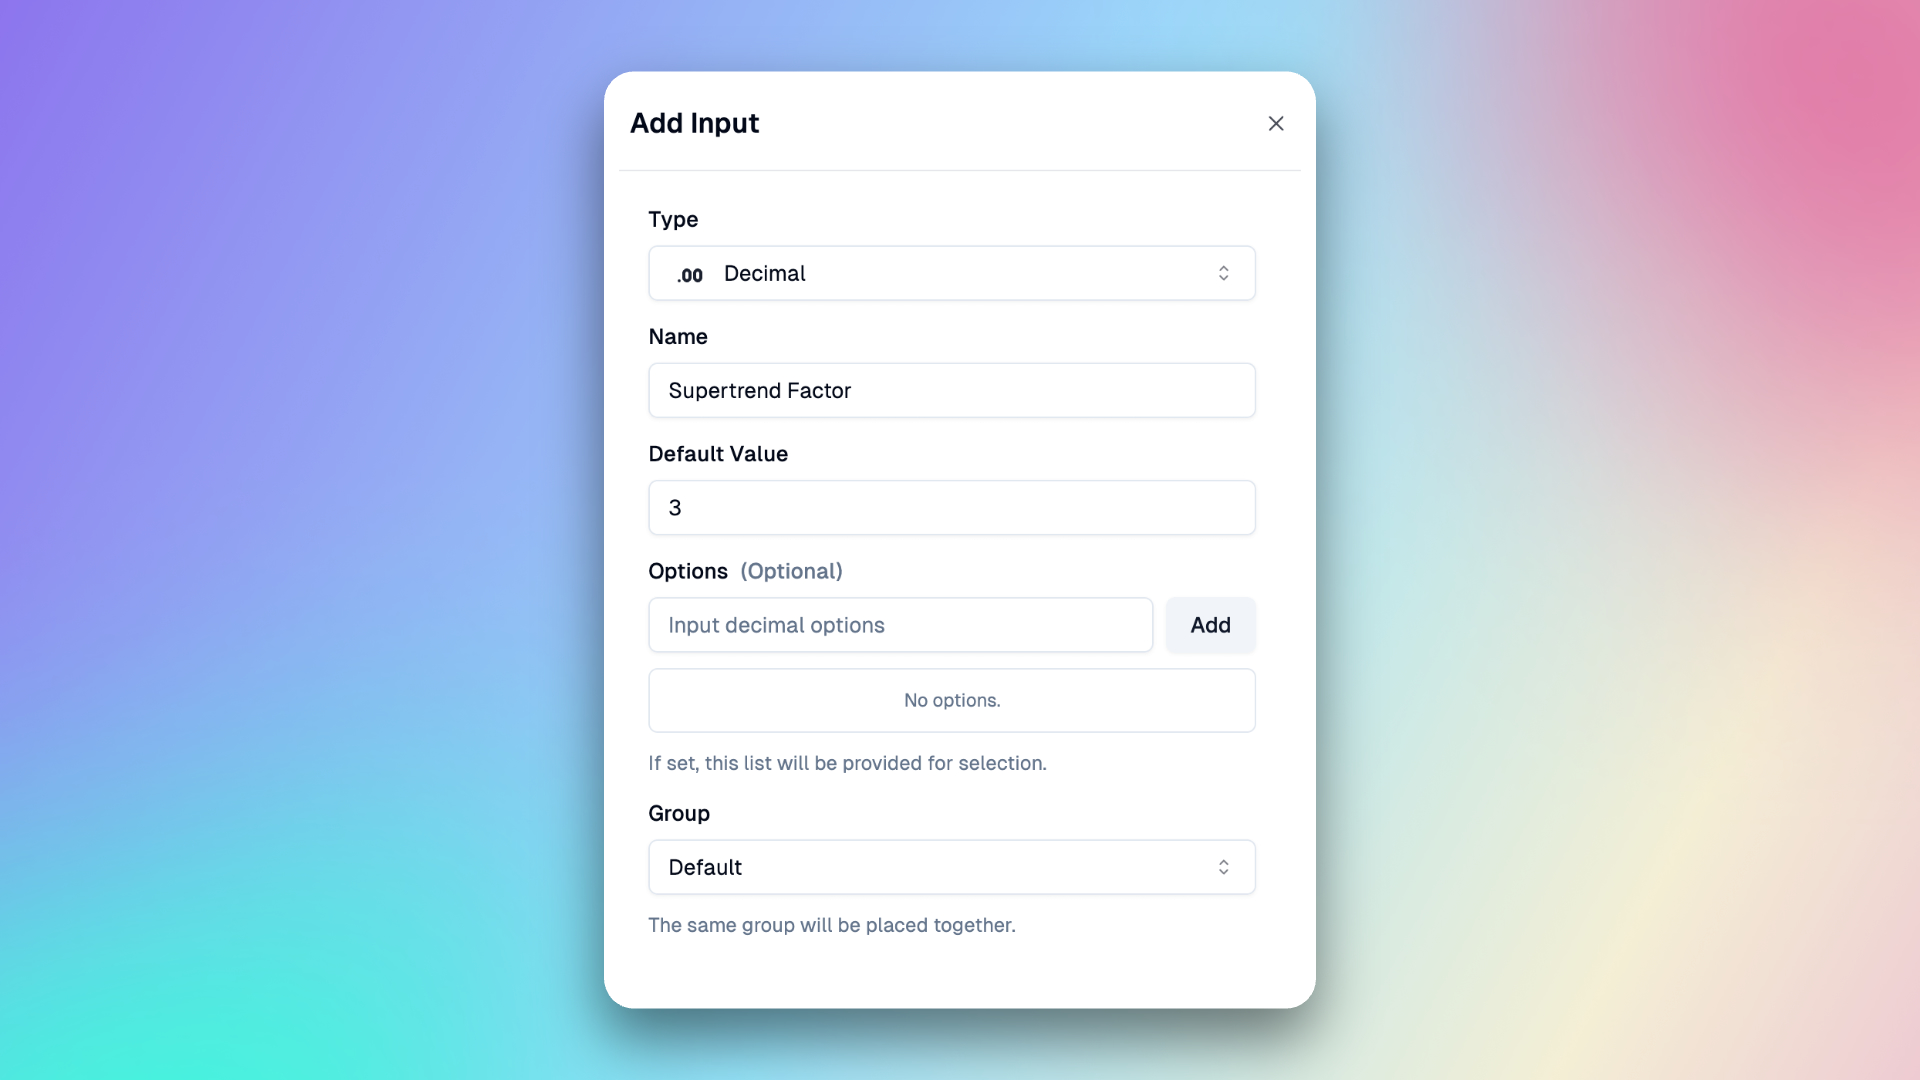
Here we create two Number type inputs for Slow EMA Length and Fast EMA Length , and one Decimal type for the Supertrend Factor, See the screen below.
-
Slow EMA Length
-
Fast EMA Length
-
Supertrend Factor
you can create the input here, or when you create the indicator, select to use the Input, and then you can quickly create it.
Note: The difference between Number and Decimal is that Number can only be an integer while Decimal can be either an integer or a decimal fraction.
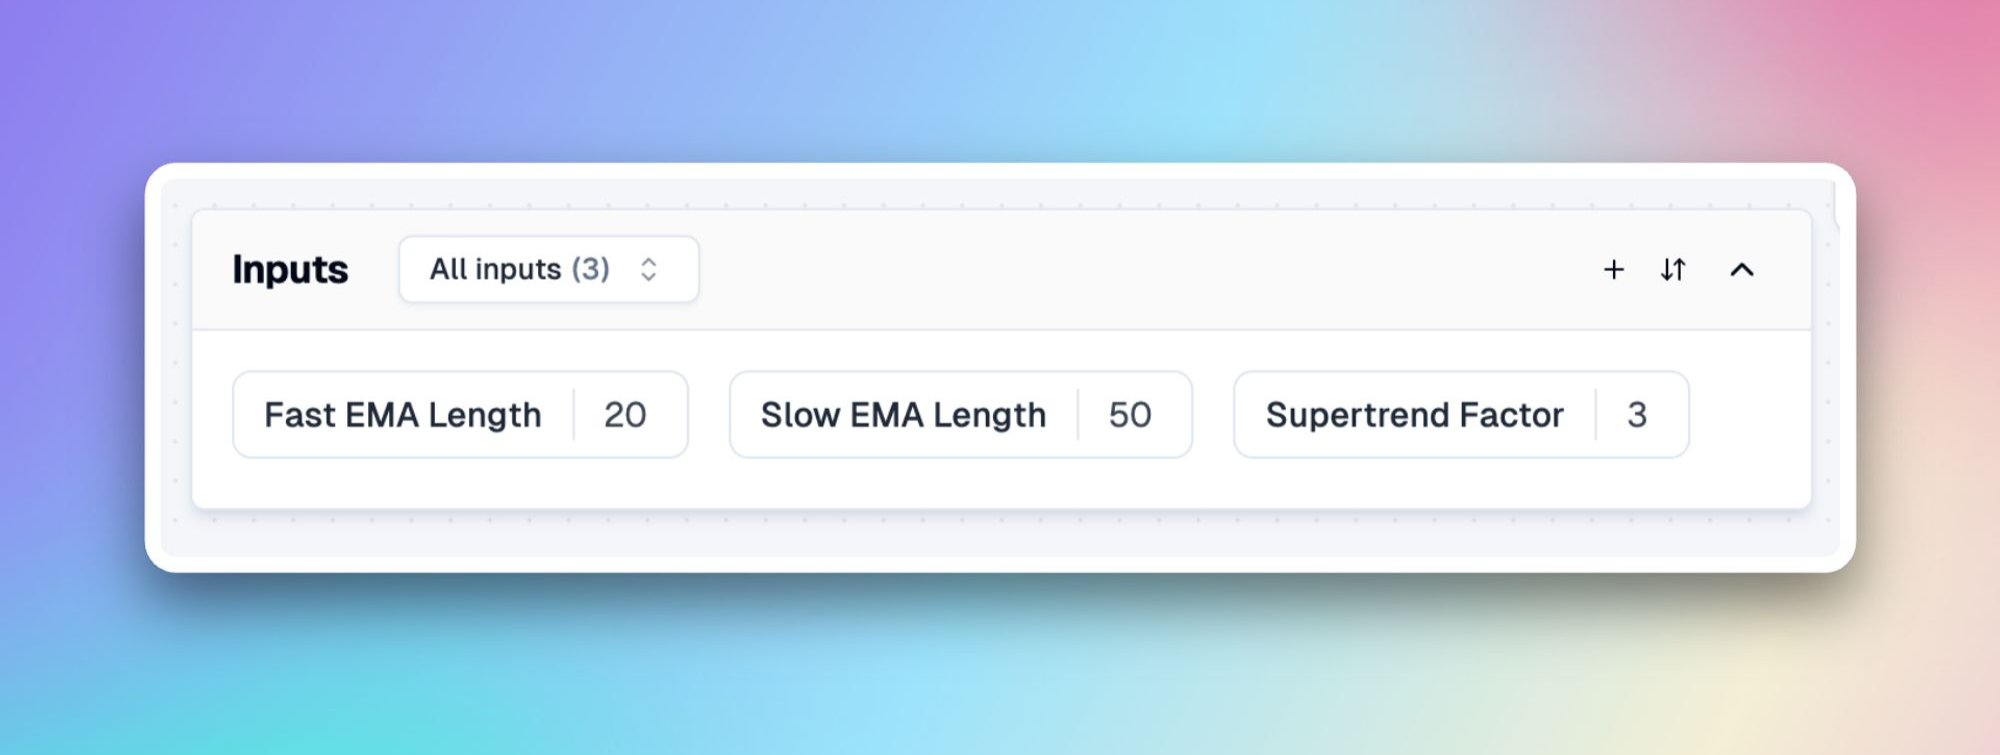
After completing the setup, we'll have these three Inputs in our Inputs panel.
Add indicator
Next, select indicators in the right panel, here you can search for indicators, here we search for ema and supertrend respectively and then add them.
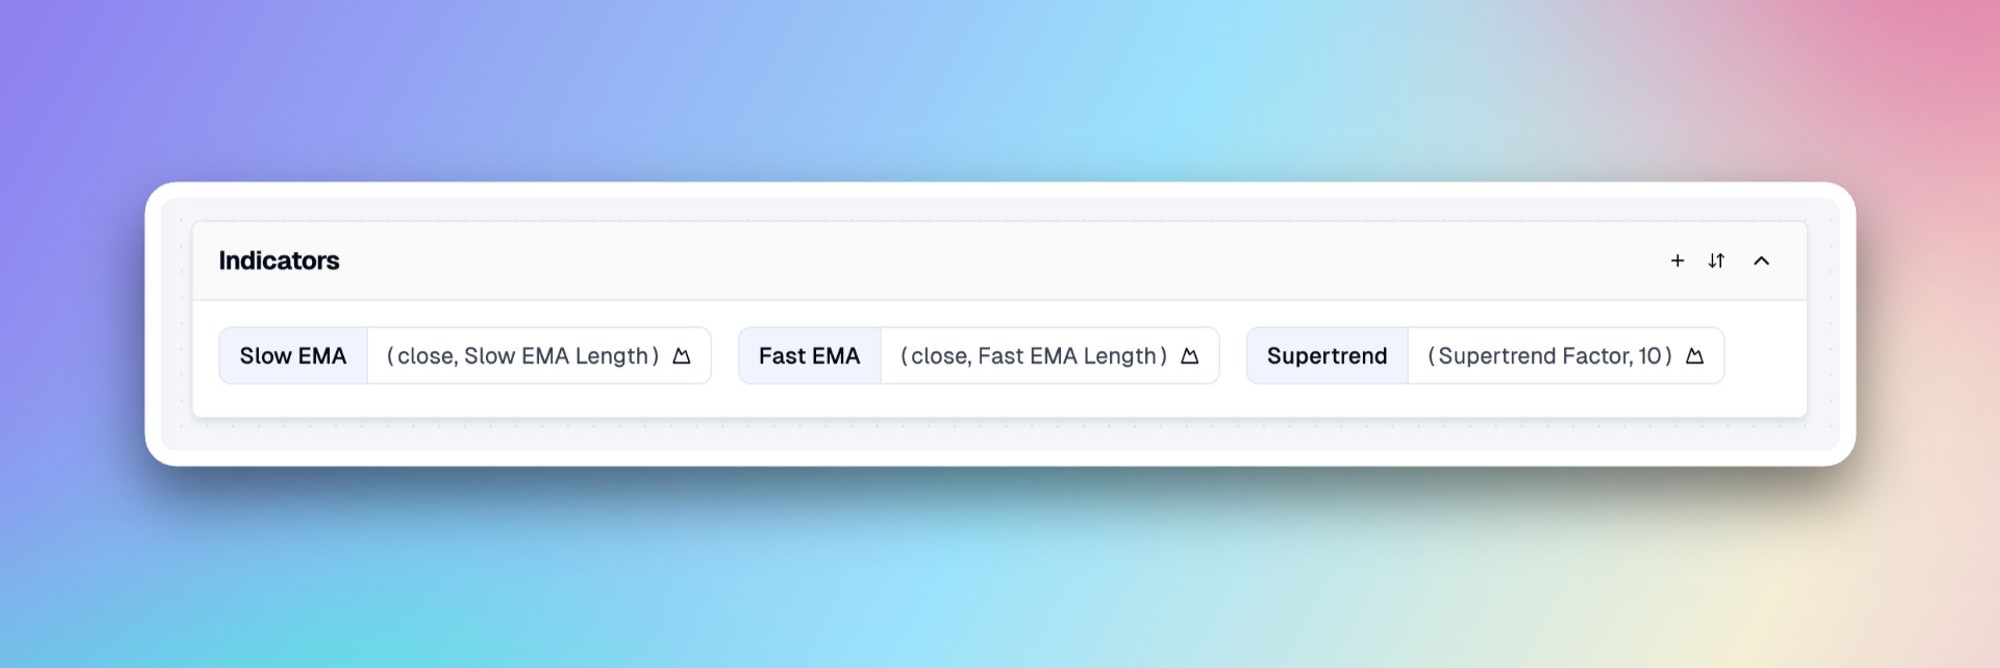
We need to create three indicators: Slow EMA, Fast EMA, and Supertrend.
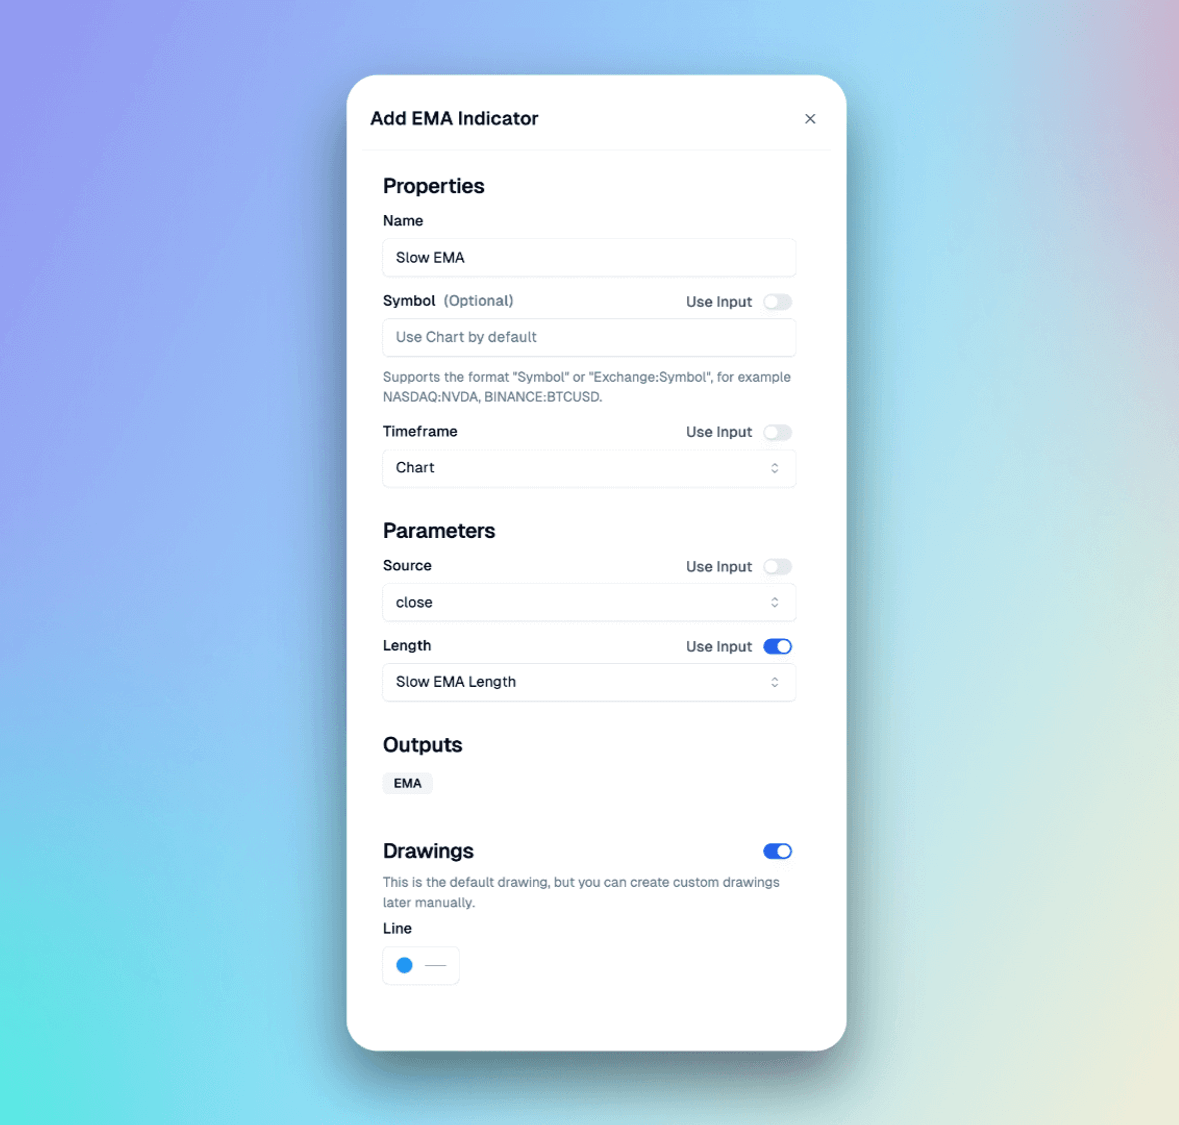
In the dialog, we just need to enter the indicator names and bind the parameters to the corresponding Inputs we've just created, and select the plot style in Plots, such as the color and width of the line.
-
Slow EMA
For the Length parameter, we can use a fixed value or an Input. To make it easier to adjust the value in the TradingView settings, we'll enable 'Custom' and select the 'Slow EMA Length' we just created.
-
Fast EMA
Similarly to the Slow EMA, we'll select the Fast EMA Length as the parameter, and also set a different color for the line to differentiate it on the chart.
-
Supertrend
Search for and add the Supertrend indicator, then use the 'Supertrend Factor' Input as the parameter for the Factor, and keep the default plots properties.
After completing the setup, these three indicators will be added to our Indicators panel.
Now, click the 'Copy Code' button in the top right corner, and then create a new indicator in TradingView and paste the code. You will see the default plots of these three indicators on the main chart.
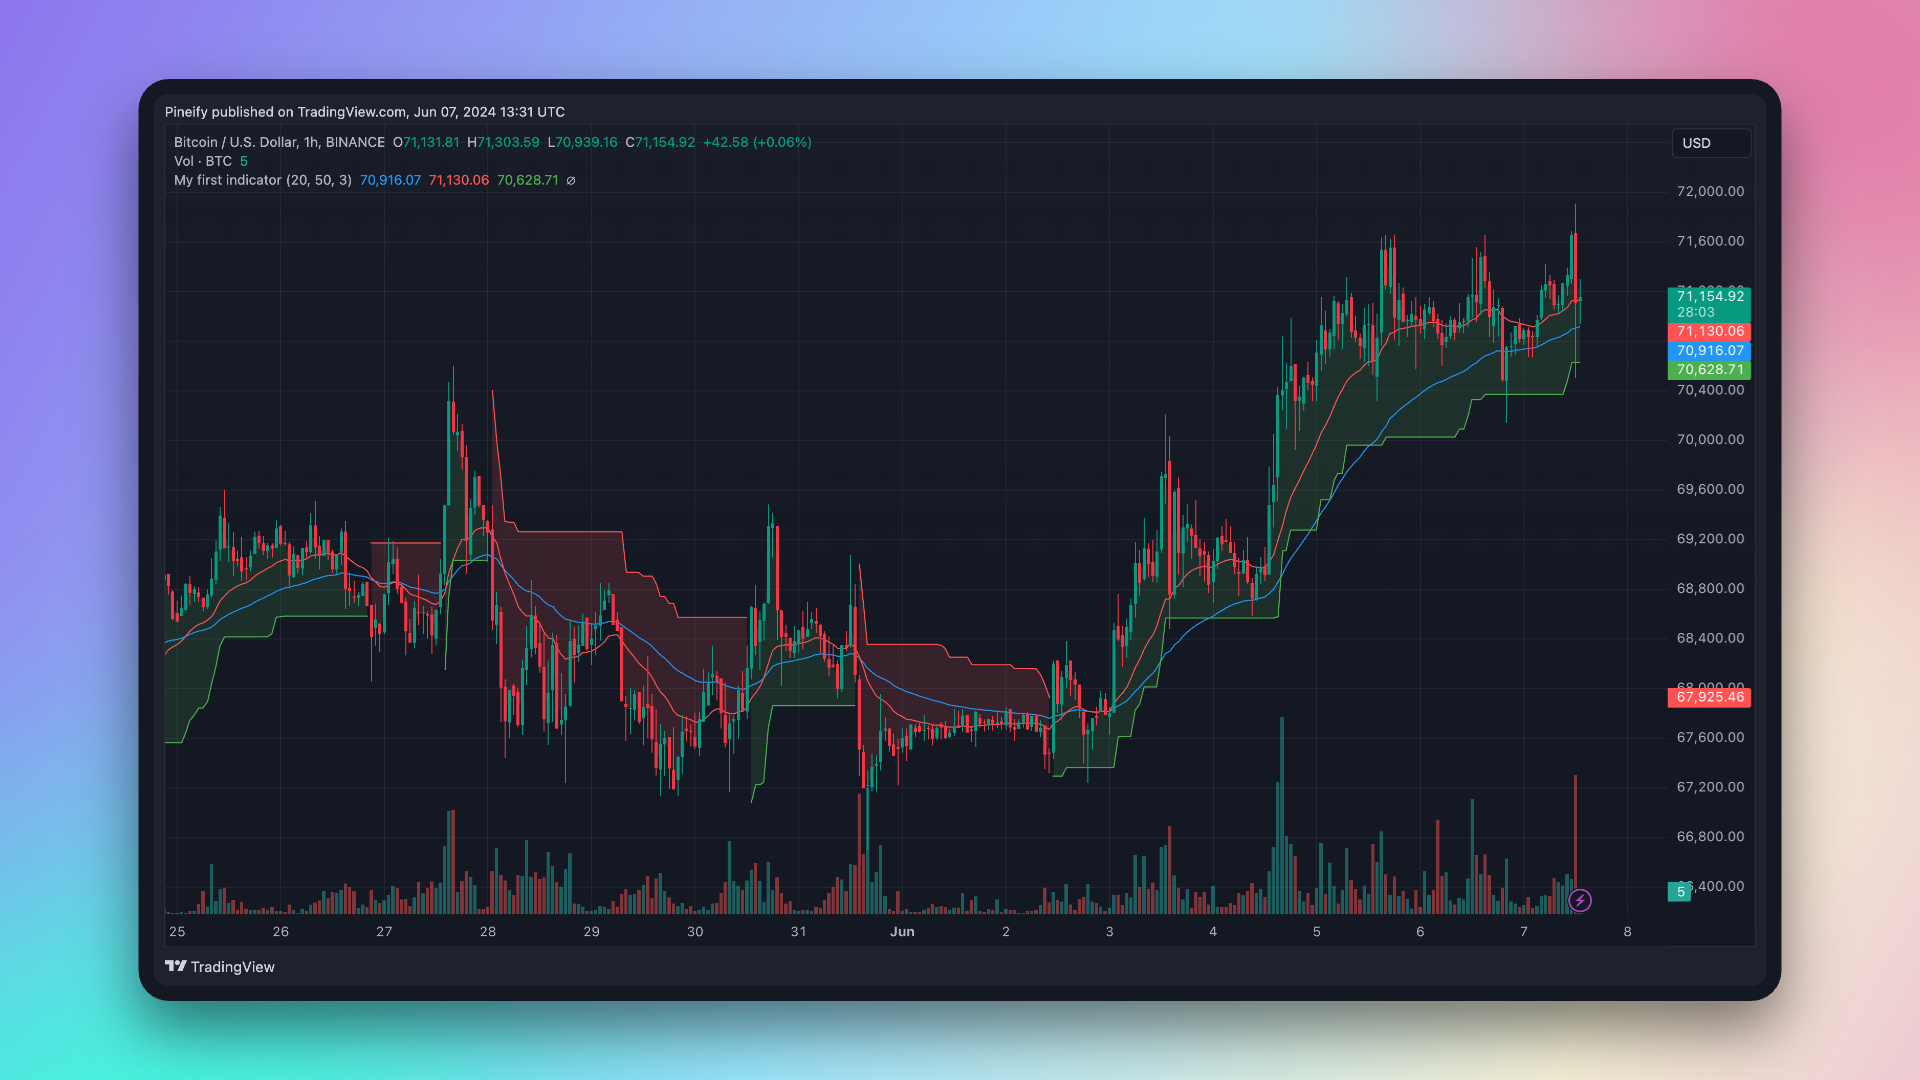
If you think there are too many lines in the chart, you can try to set the Supetrend line to transparent, only keeping the background color.
Add condition
A condition refers to whether the output of an indicator, a certain condition, or other values on each candle satisfy a certain equation, such as being greater than or less than a certain value. At the end of each candle, it will output a true or false value.
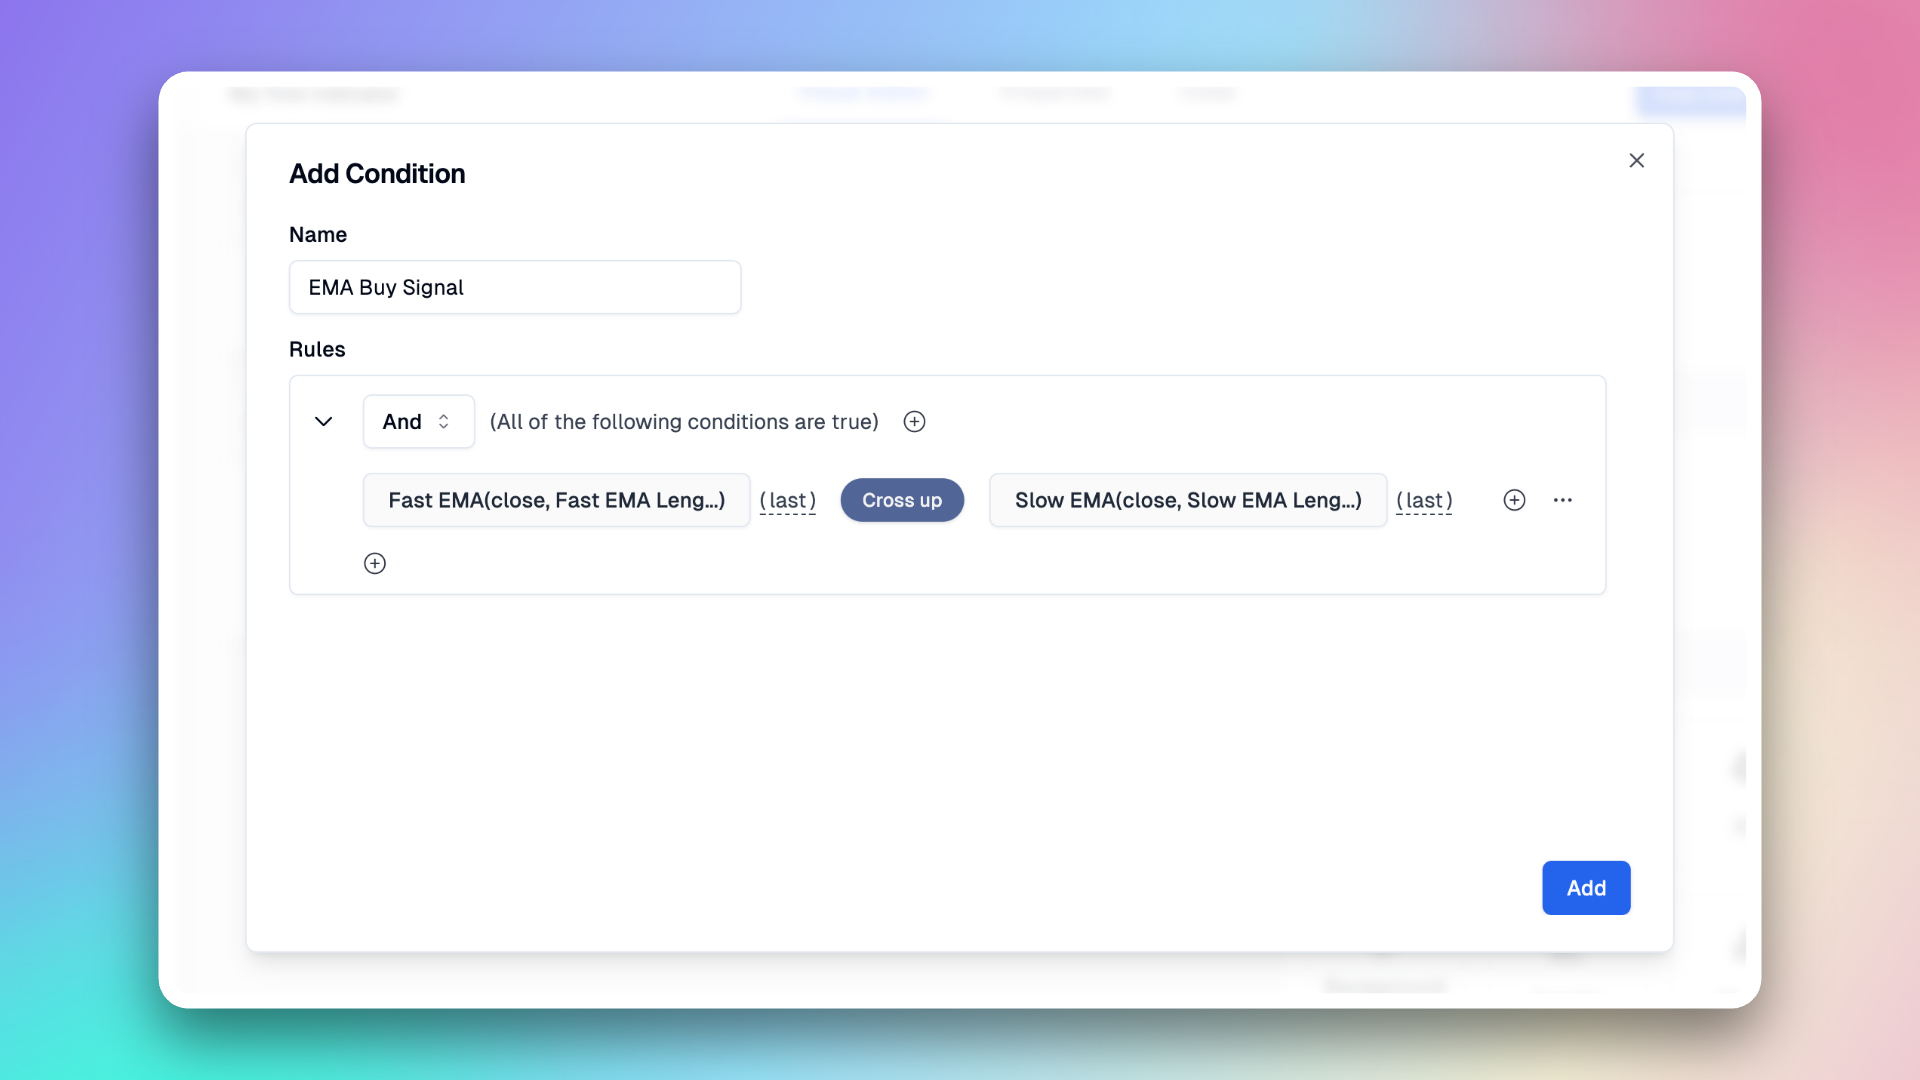
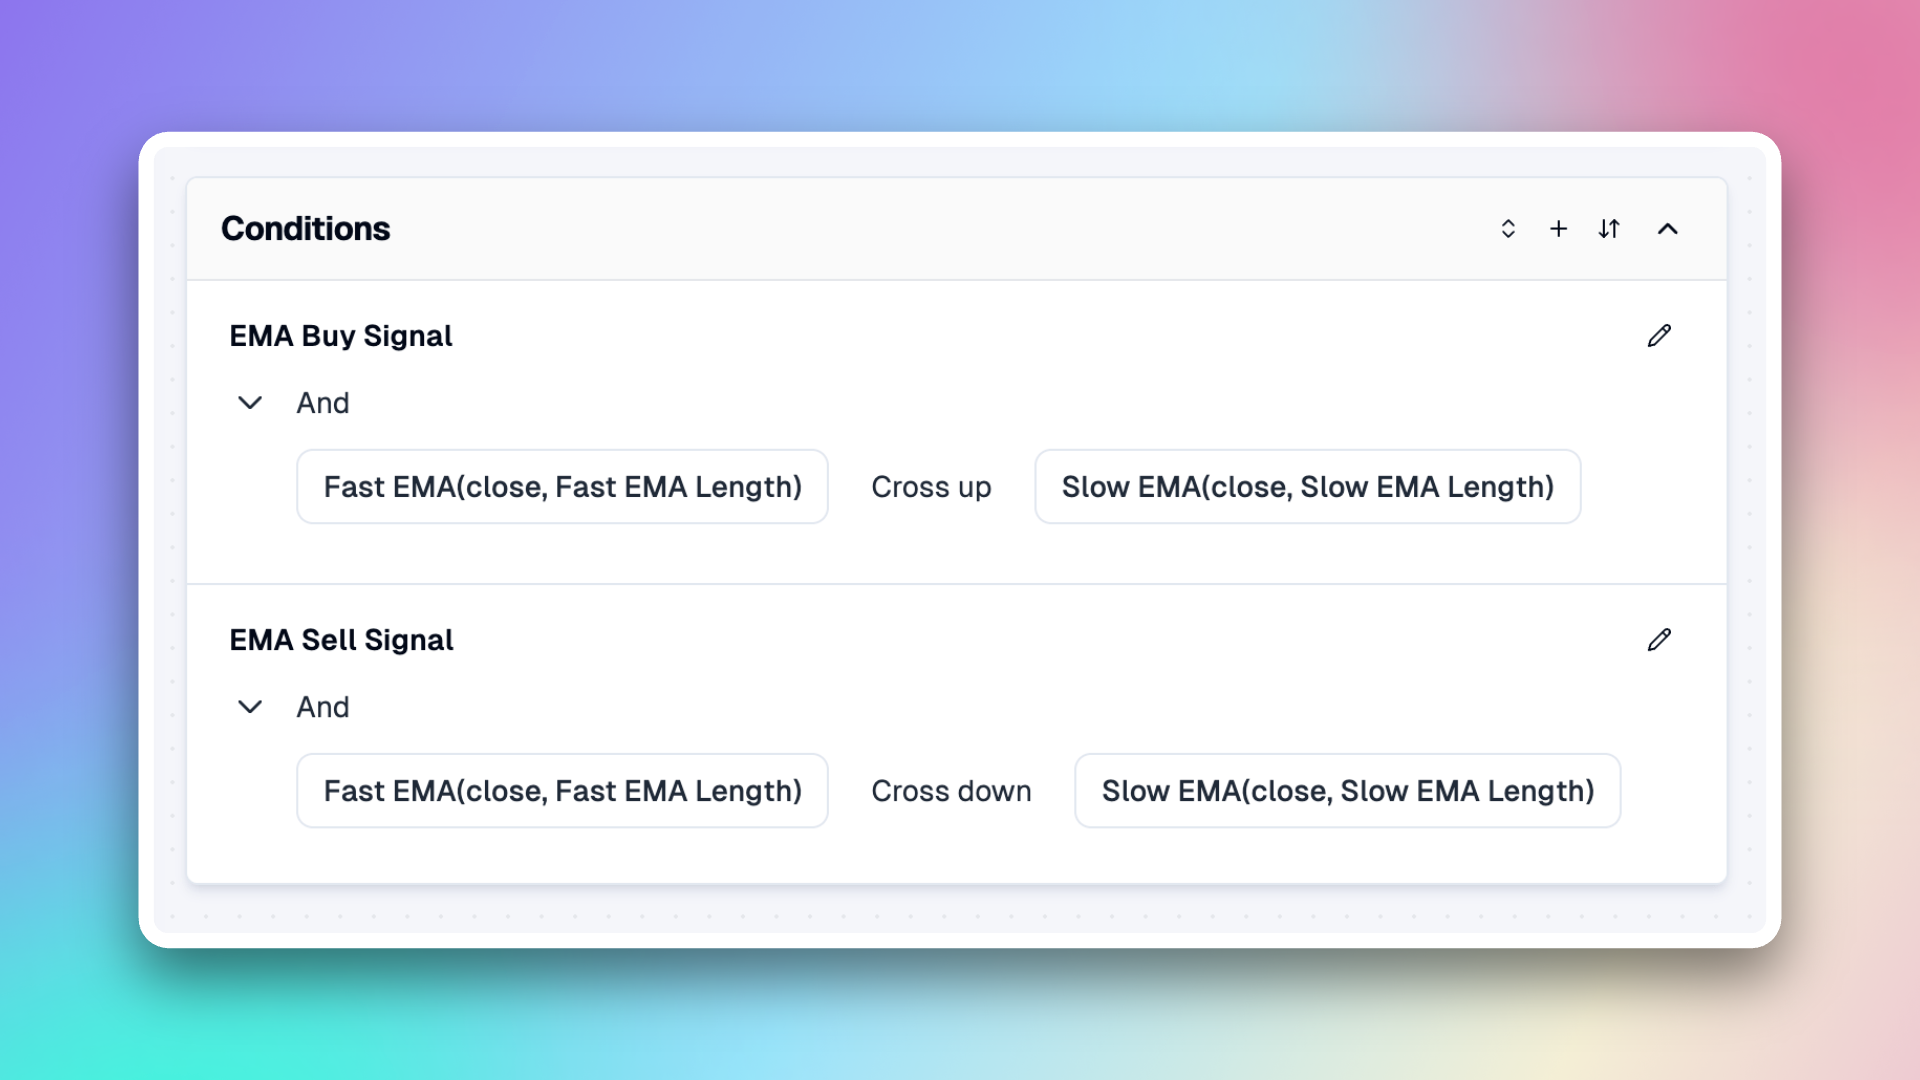
Here we'll create two conditions, EMA Buy Signal and EMA Sell Signal.
- EMA Buy Signal: The condition is satisfied when the Fast EMA crosses up the Slow EMA.
- EMA Sell Signal: The condition is satisfied when the Fast EMA crosses down the Slow EMA.
Next, click on the Condition in the right panel to create. In the Condition Editor, create the conditions as follows.
-
EMA Buy Signal
-
EMA Sell Signal
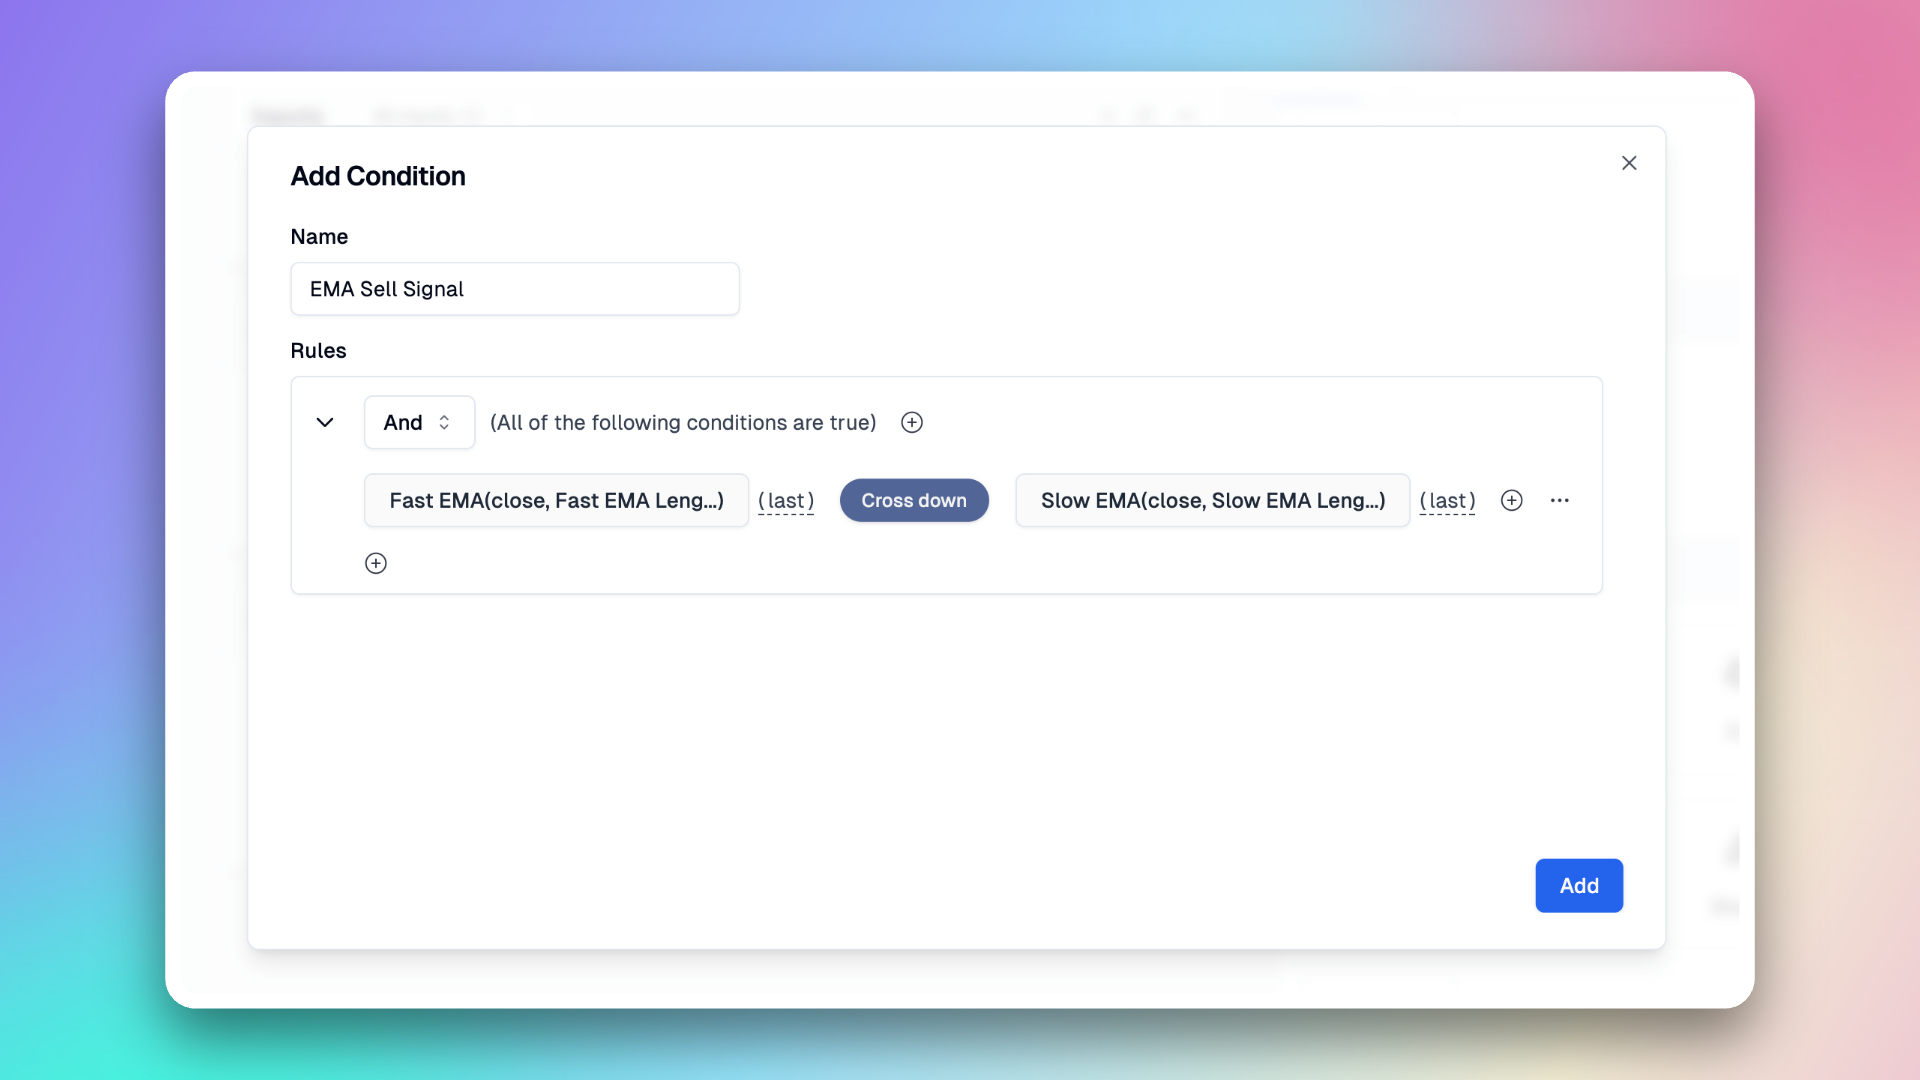
After completing the setup, these two conditions will be added to our conditions panel.
Next, let's plot the buy and sell signals on the chart.
Add plot
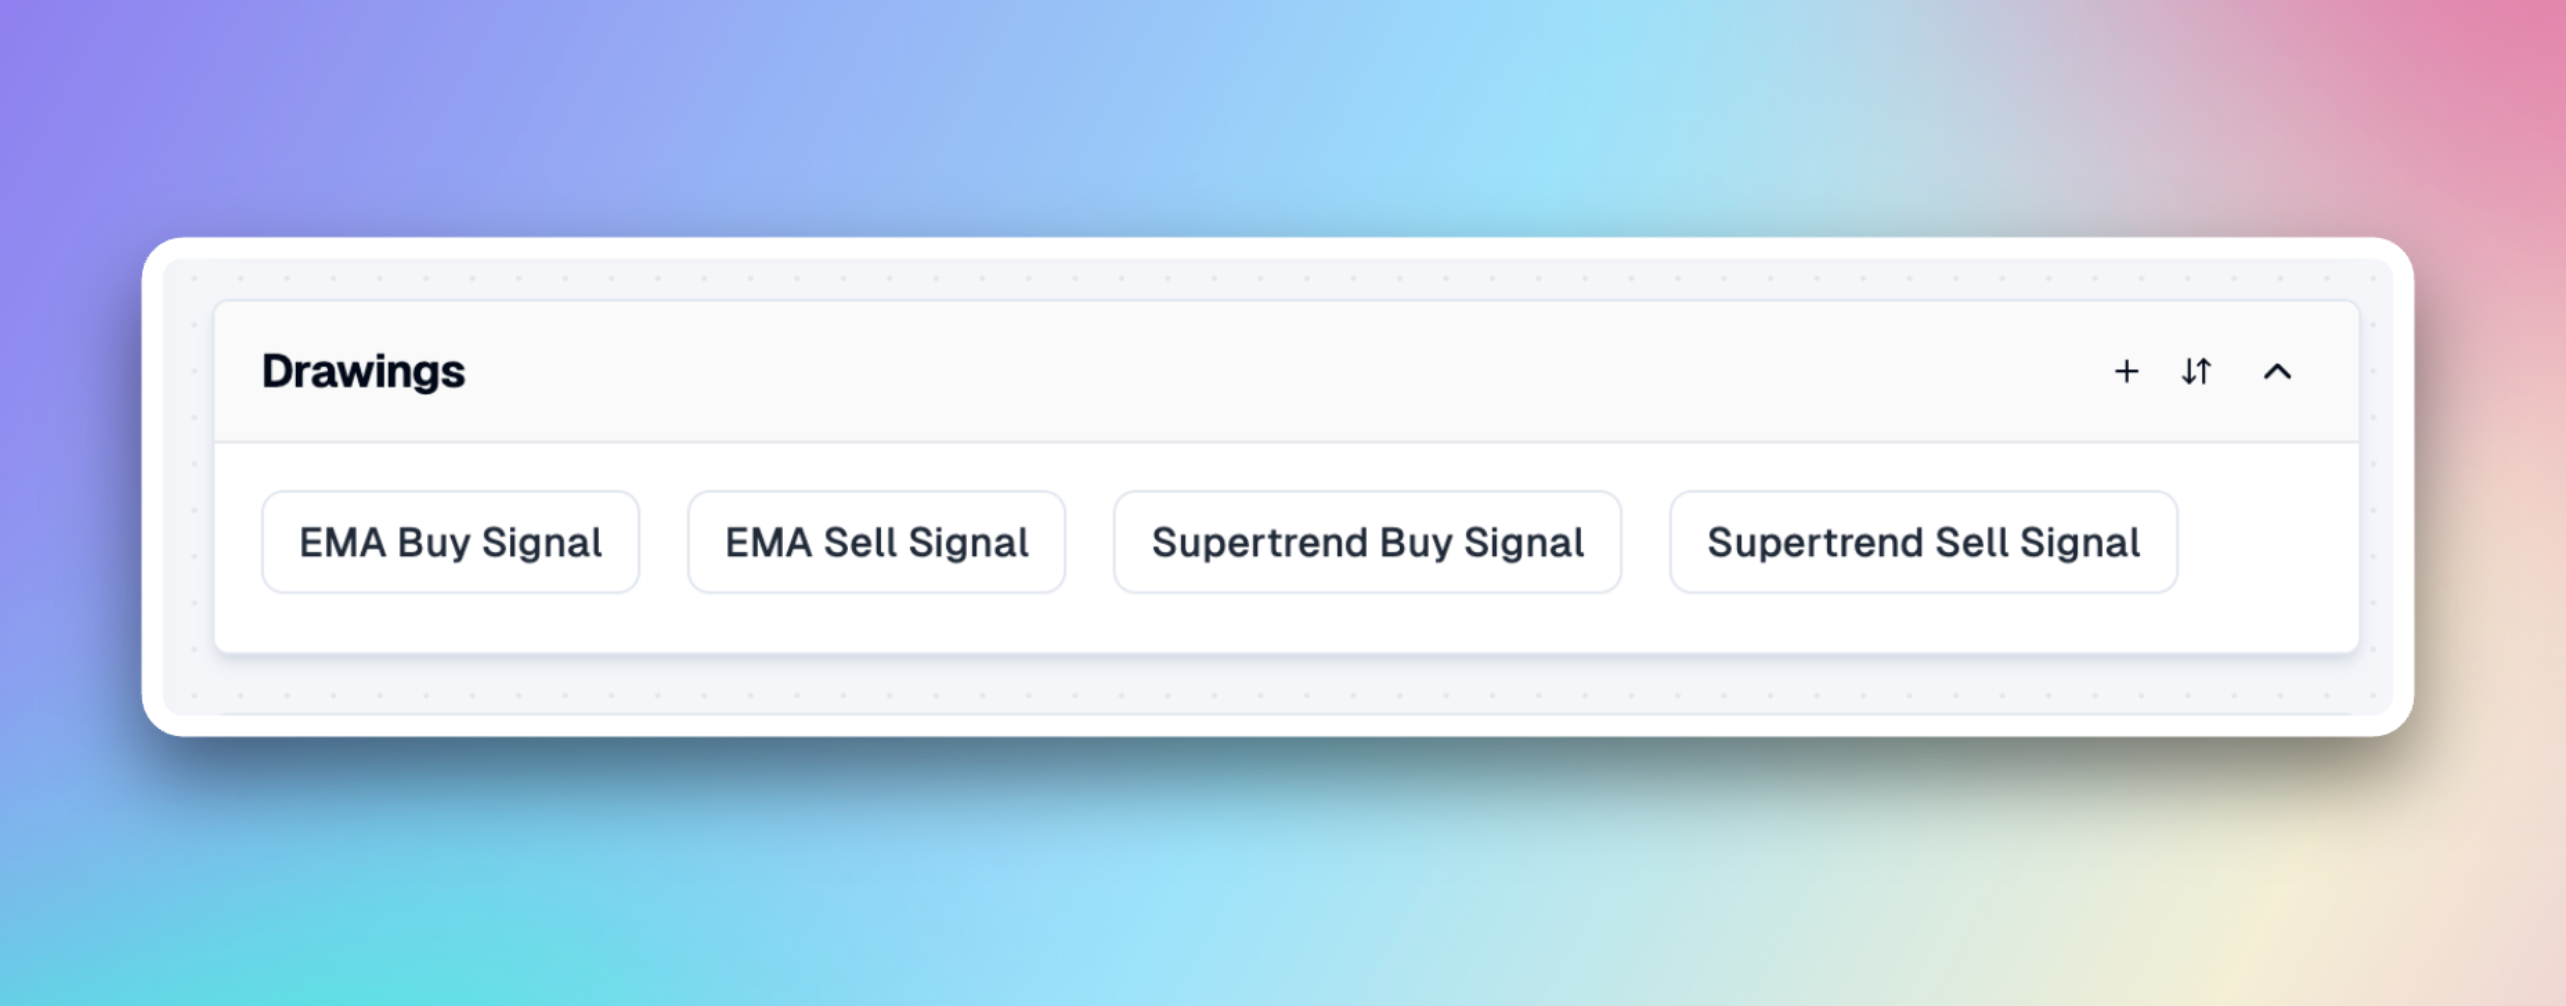
The content we plot on the chart can all be achieved through Plots. Here, we will mark the EMA Buy Signal, EMA Sell Signal, Supertrend Buy Signal, and Supertrend Sell Signal on the chart.
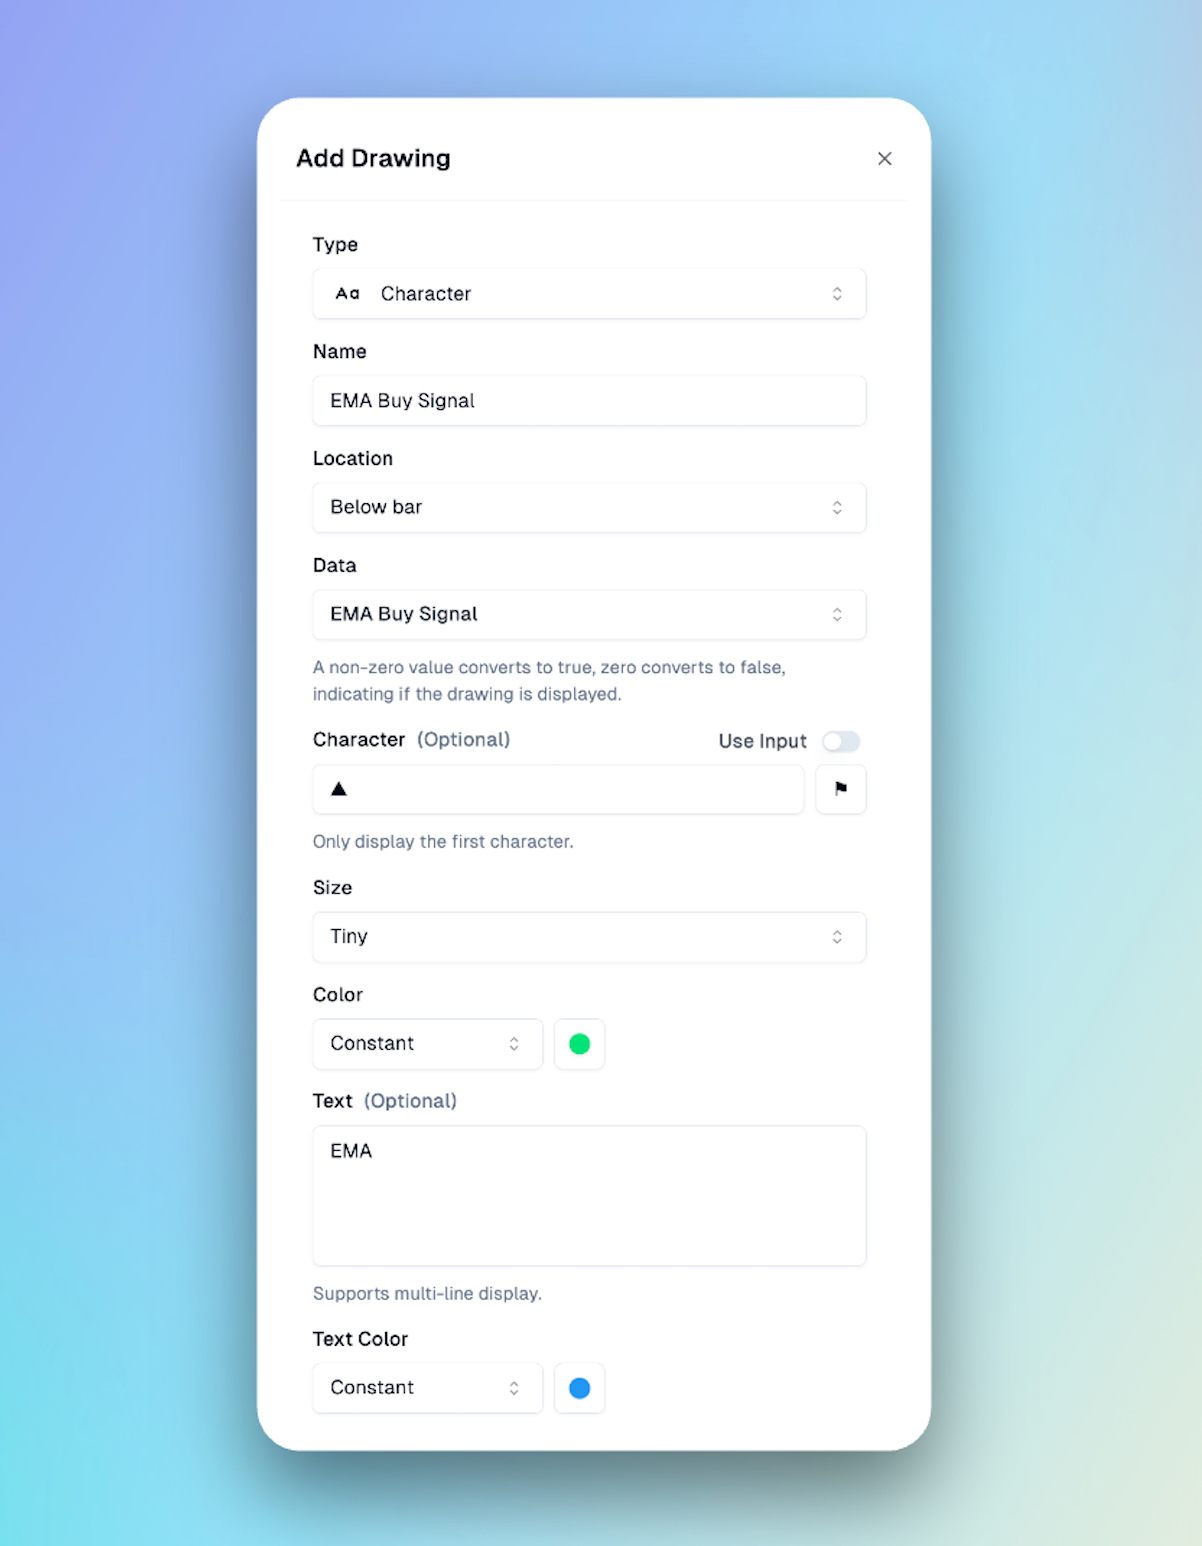
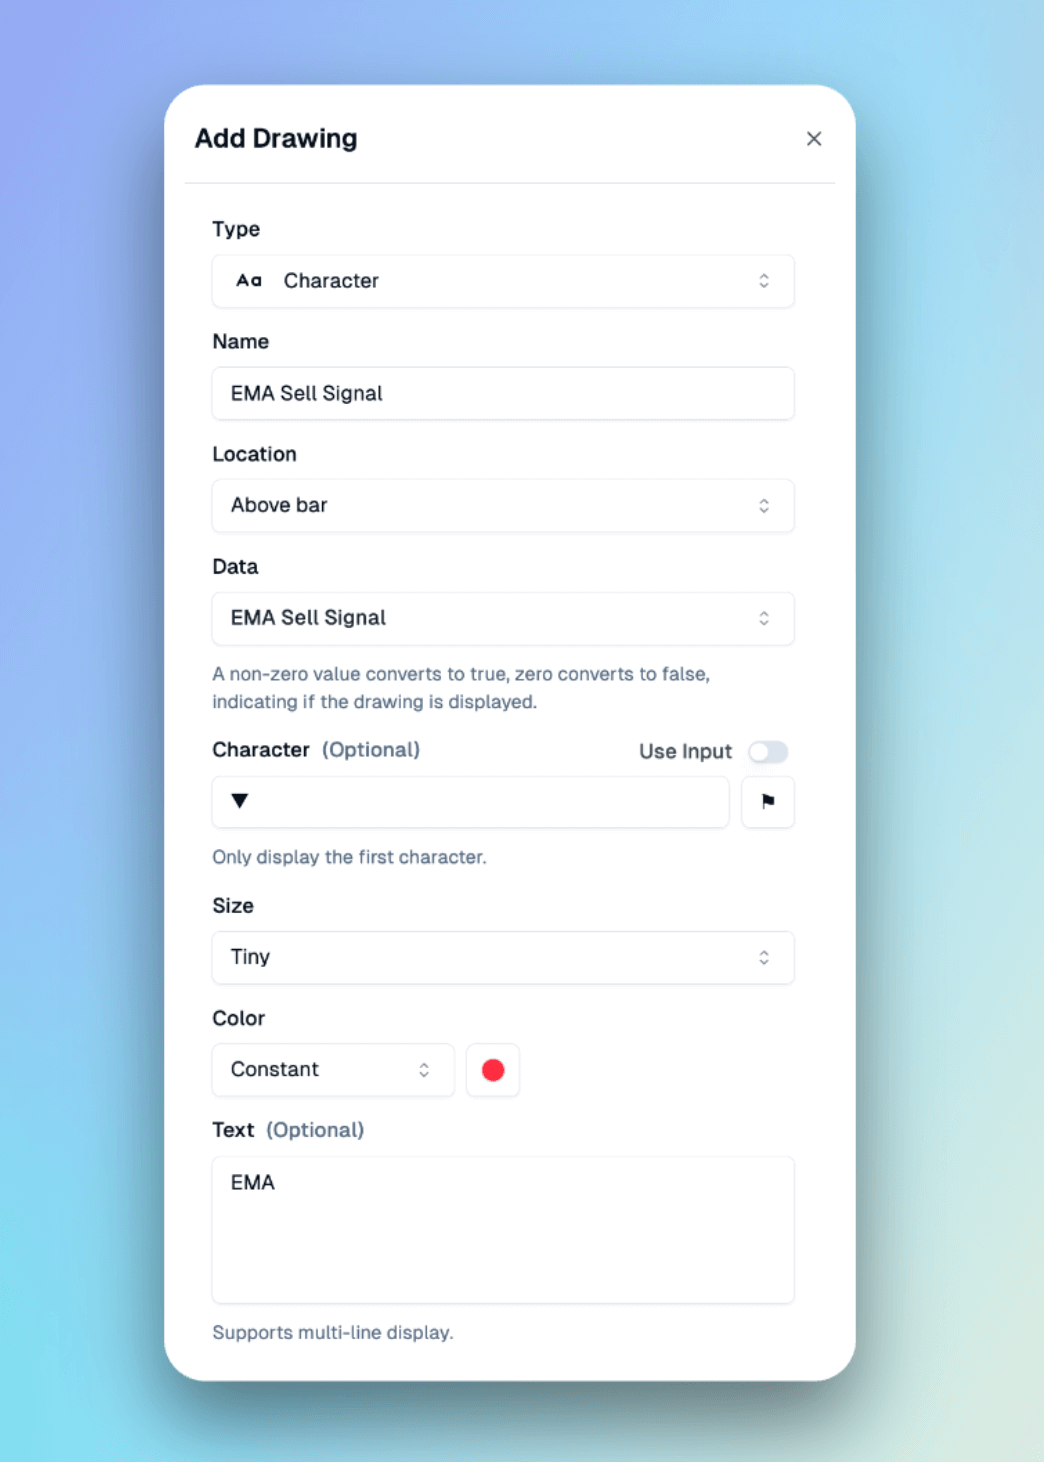
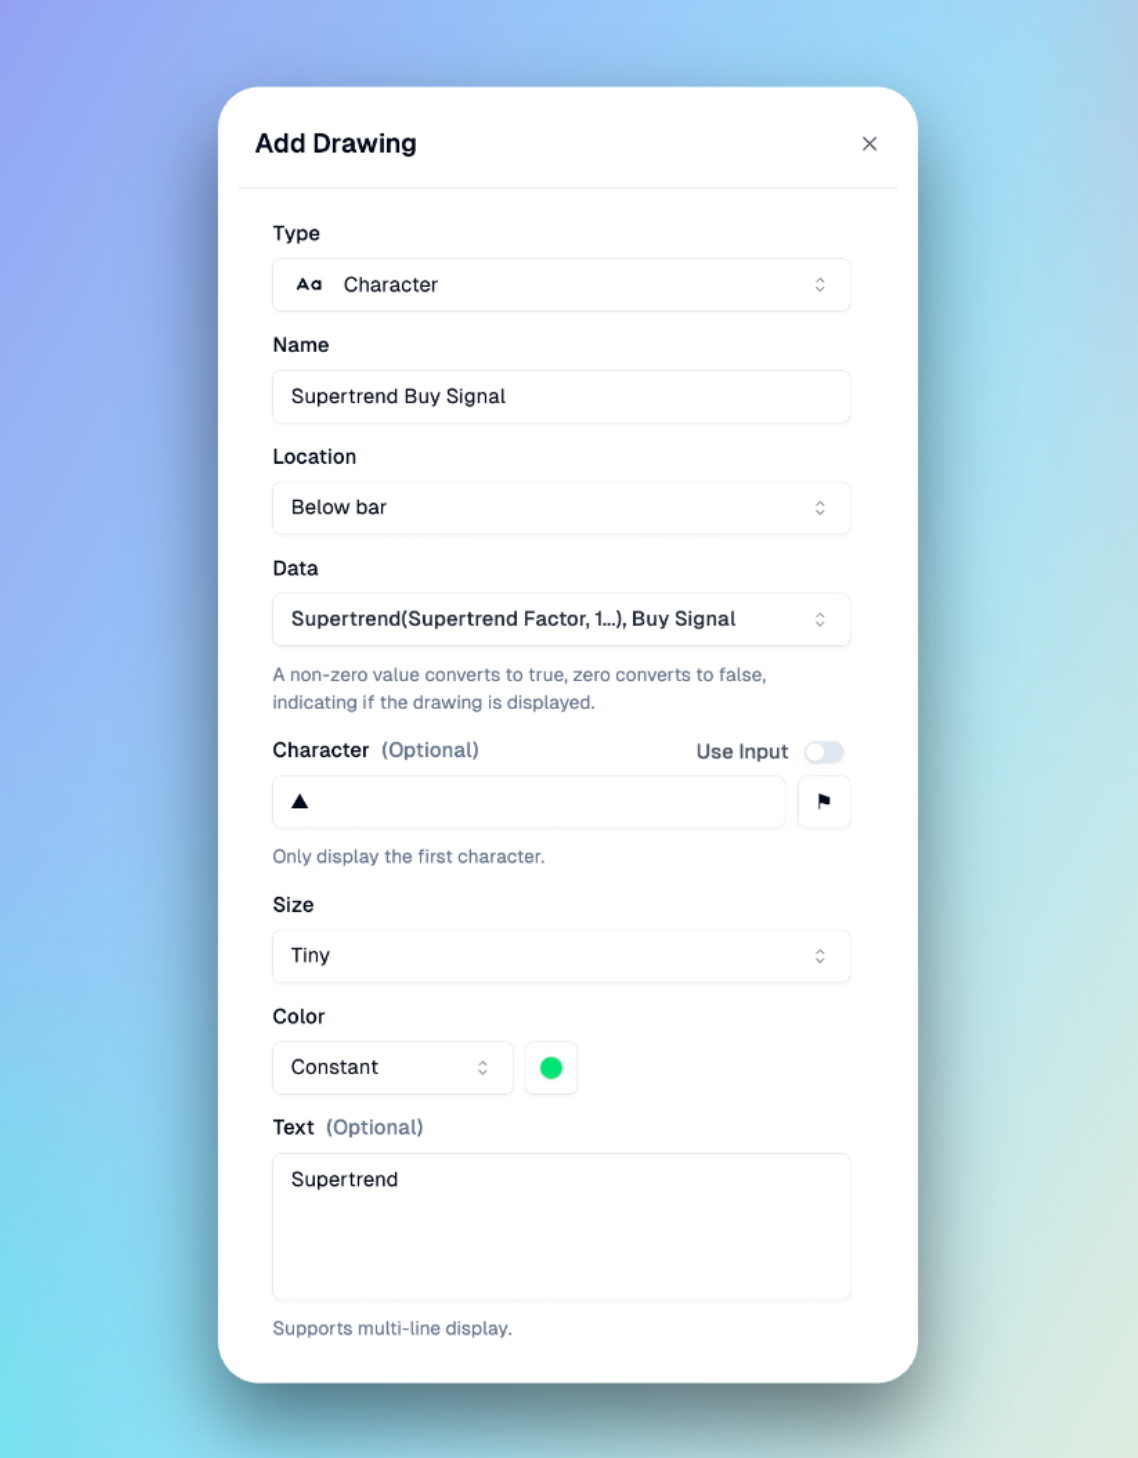
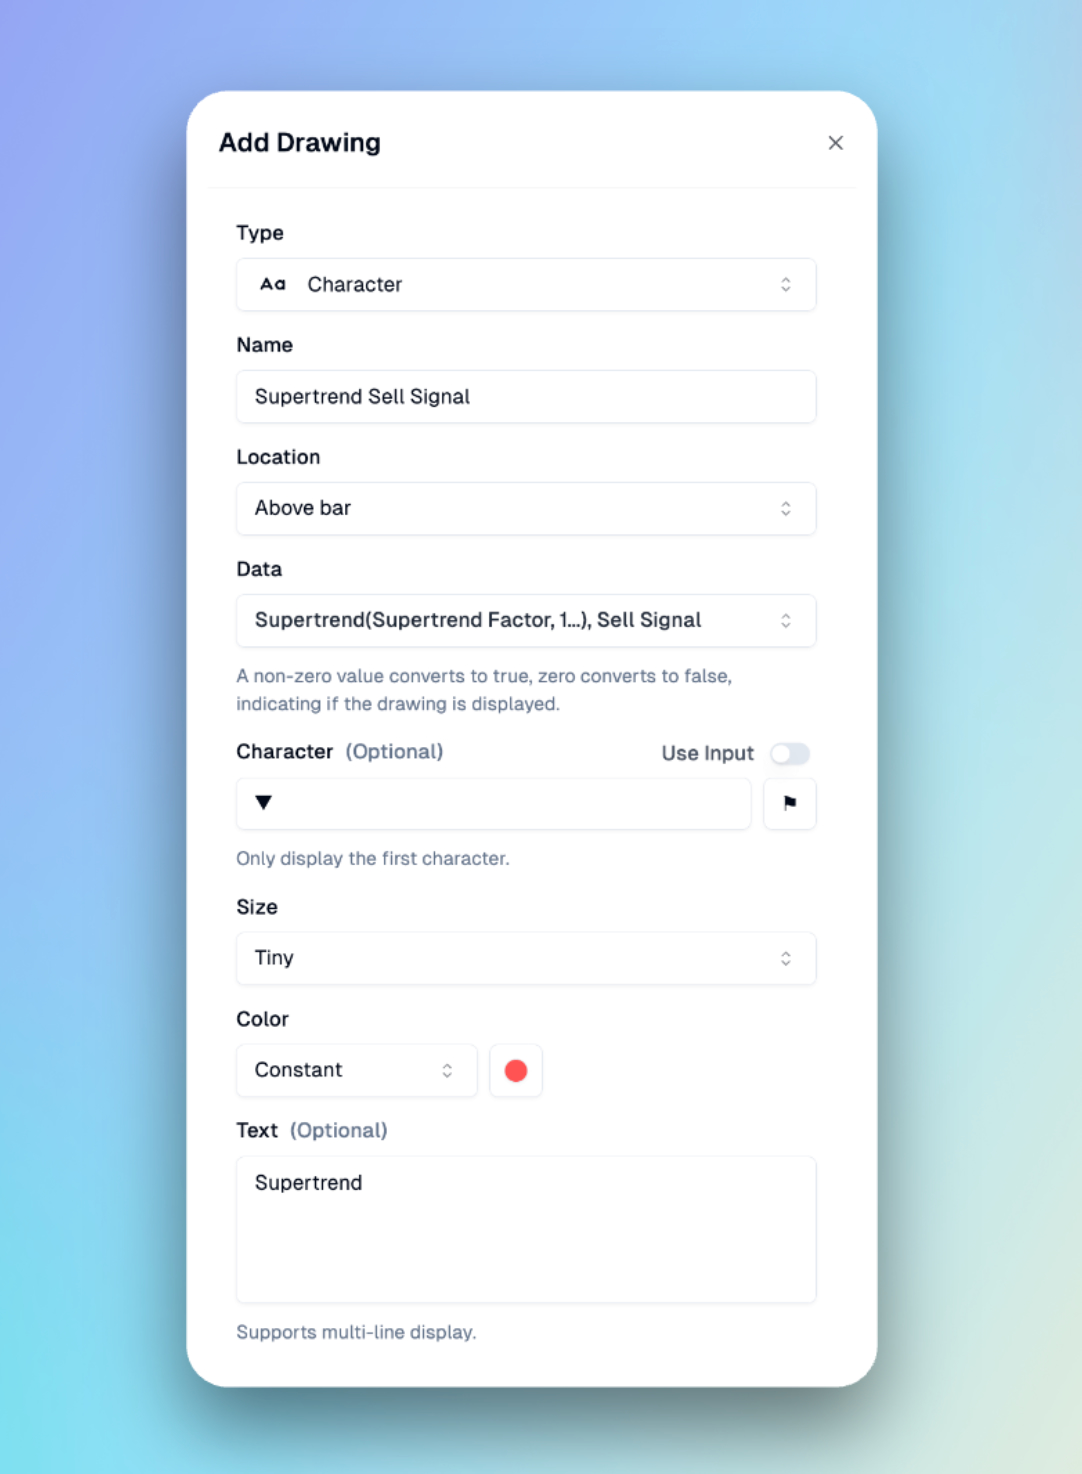
Here we'll choose to draw the character. Character plots can be used to plot symbols, and we'll use a green ▲ to represent buy signals and a red ▼ to represent sell signals.
- EMA Buy Signal Plot
- The Location property specifies where the indicator should be plotted. Here we'll uniformly plot the buy signals below the Bar and the sell signals above the Bar.
- The Data property represents the condition for plotting. Any value selected will be converted to true or false. True means the plot will be drawn on that bar, while false means no plot will be drawn.
- The Text property represents the text to be displayed. Here we'll show the names of the indicators to differentiate the buy and sell signals generated by each.
-
EMA Sell Signal Plot
-
Supertrend Buy Signal Plot
-
Supertrend Sell Signal Plot
After completing the setup, these four plots will be added to our Plots panel.
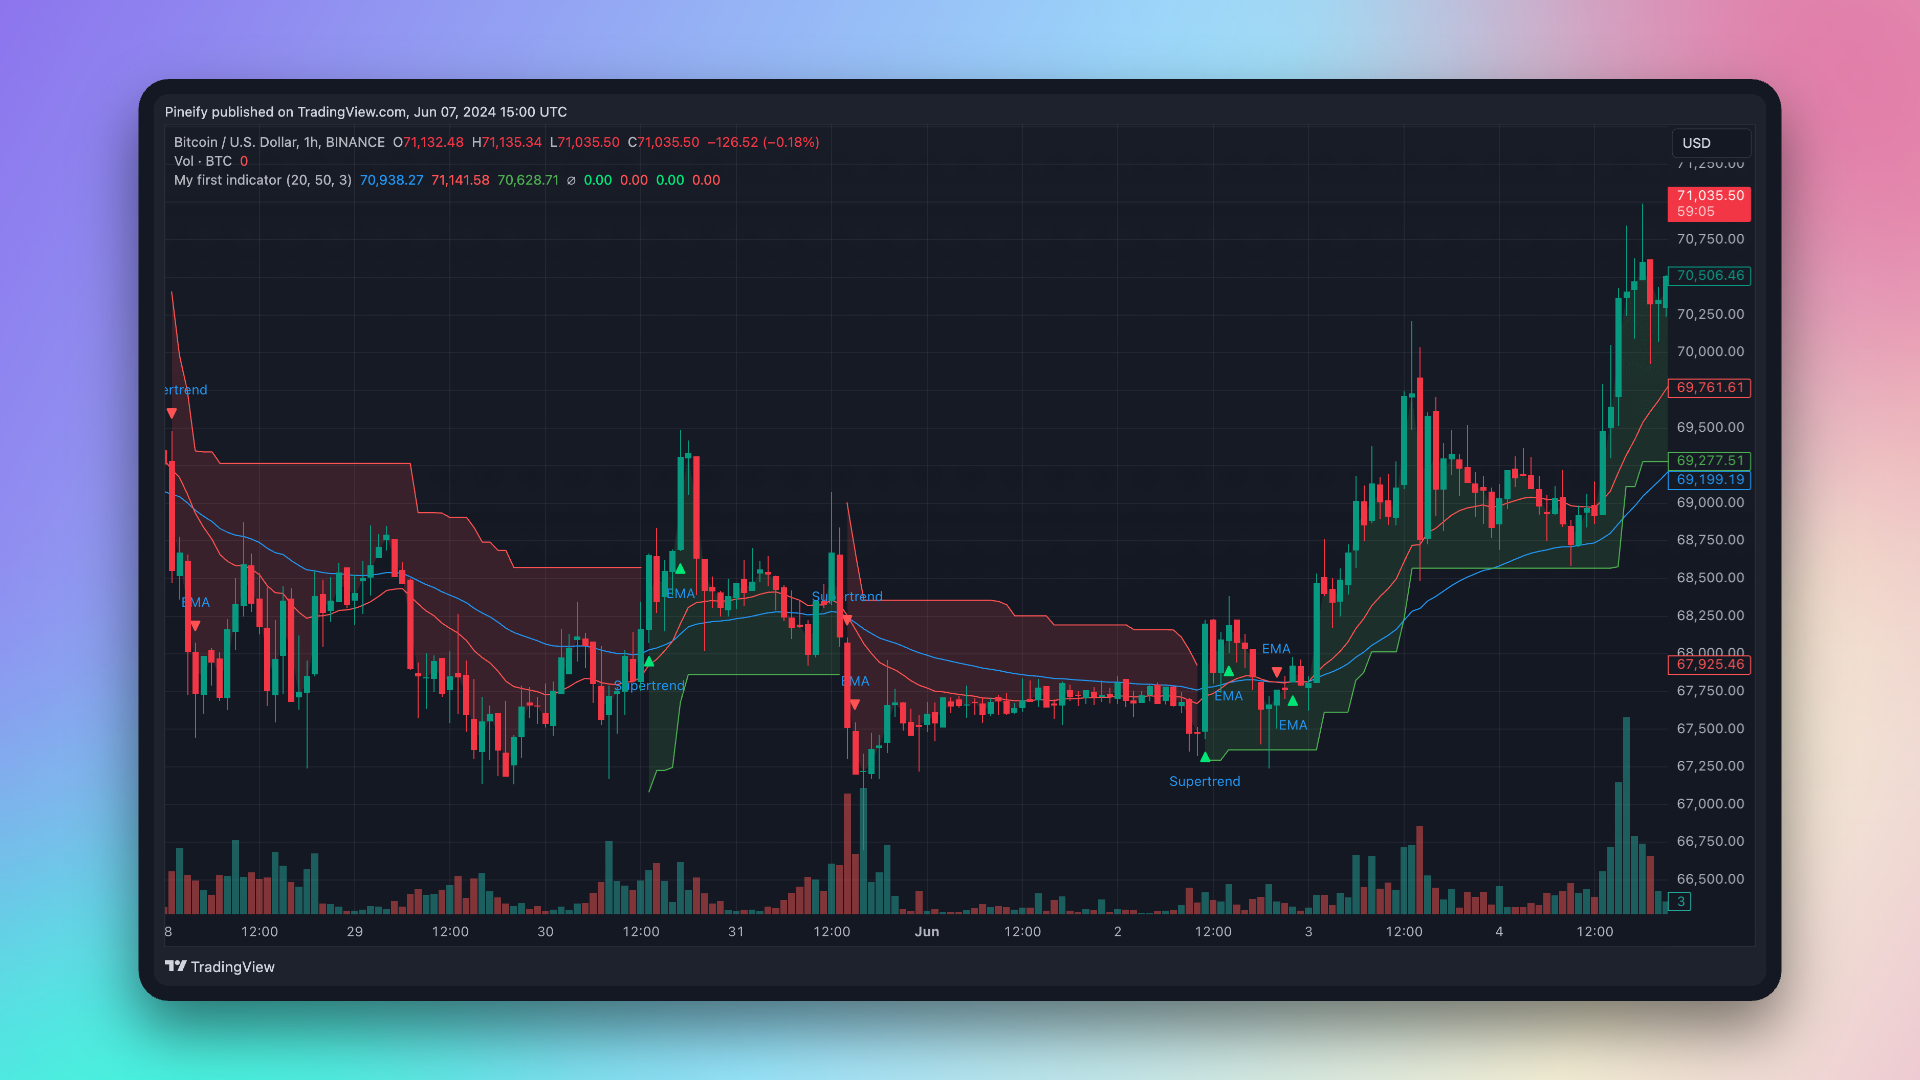
Now the buy and sell signal points are displayed on the main chart.
Next, let's add alerts for buy and sell signals, so we can receive real-time notifications on emails and Apps.
Add alert
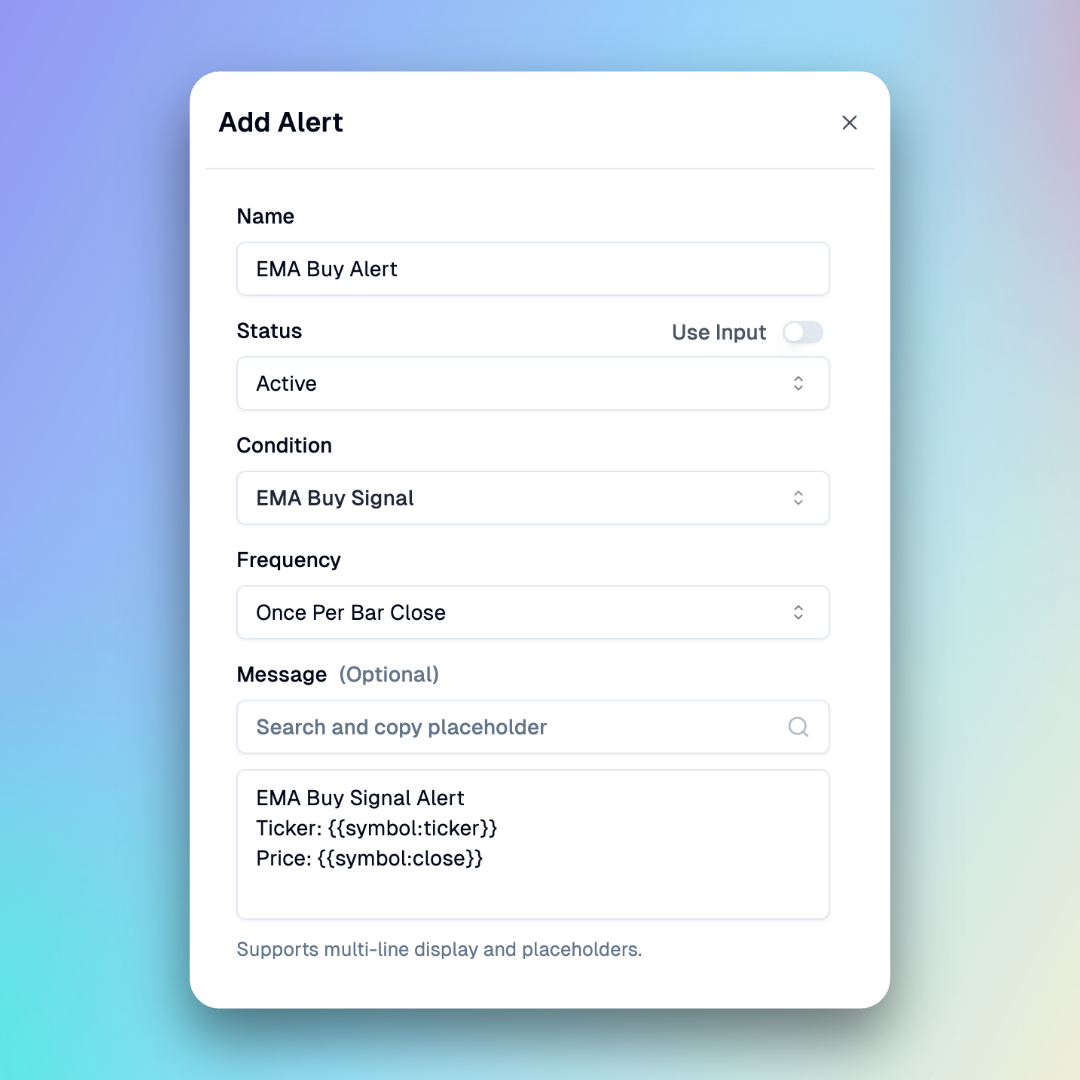
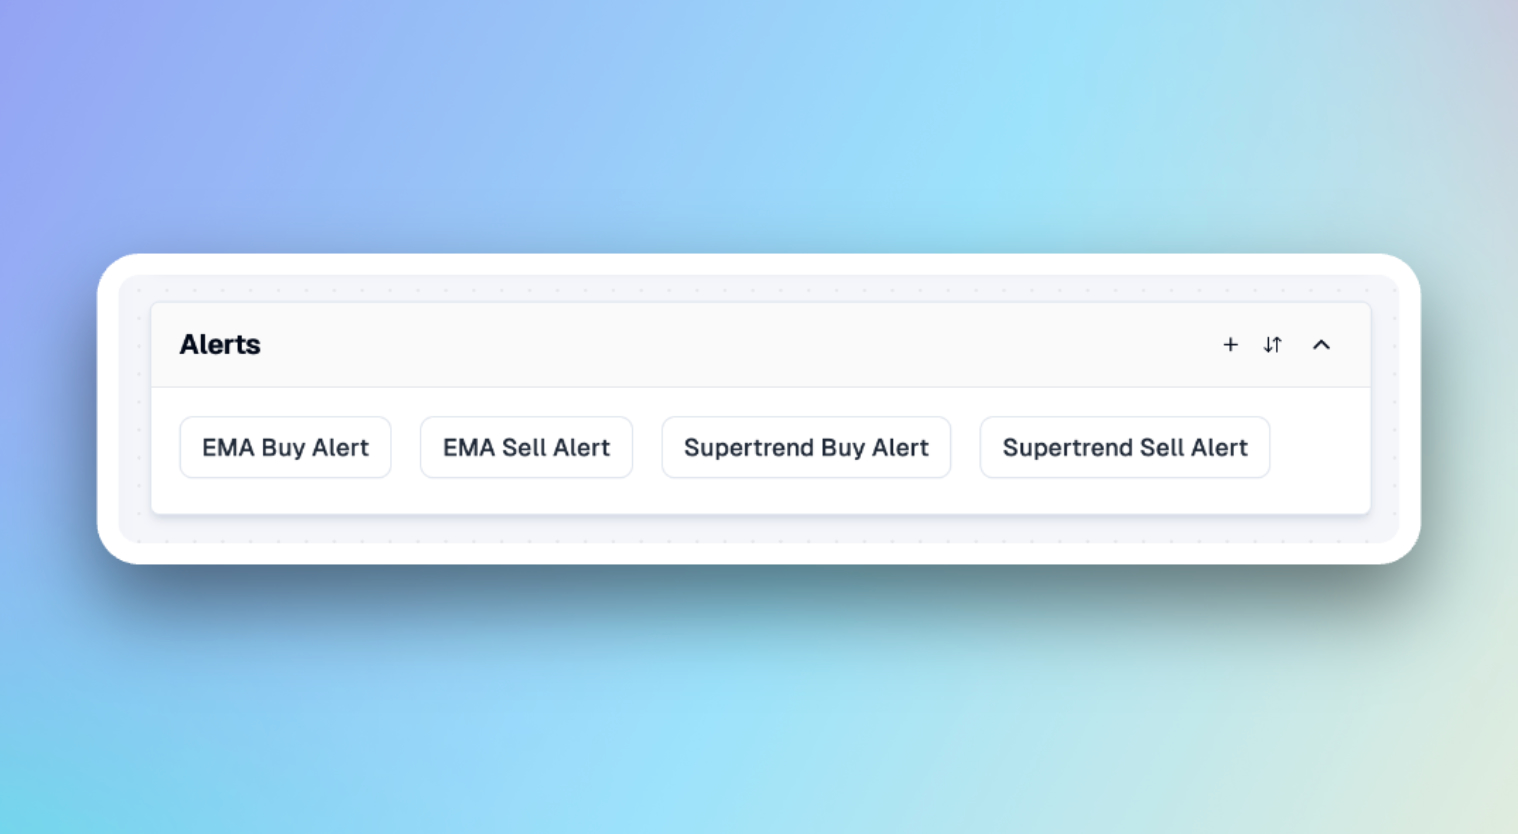
Here we will create four alerts, respectively EMA Buy Alert, EMA Sell Alert, Supertrend Buy Alert and Supertrend Sell Alert. We need to choose the corresponding conditions in each alert, and enter the content of the alert message.
For alert messages, you can search for messages in the search box and copy placeholders into the messages.
For example, the configuration of EMA Buy Alert is as follows:
After completing the setup, these four alerts will be added to our Alerts panel.
Now, we have successfully created an indicator that displays the EMA and Supertrend indicators on the main chart, along with their respective buy and sell points and alerts.
Next, paste the latest code on TradingView, and then take the final step, configure the alert on TradingView.
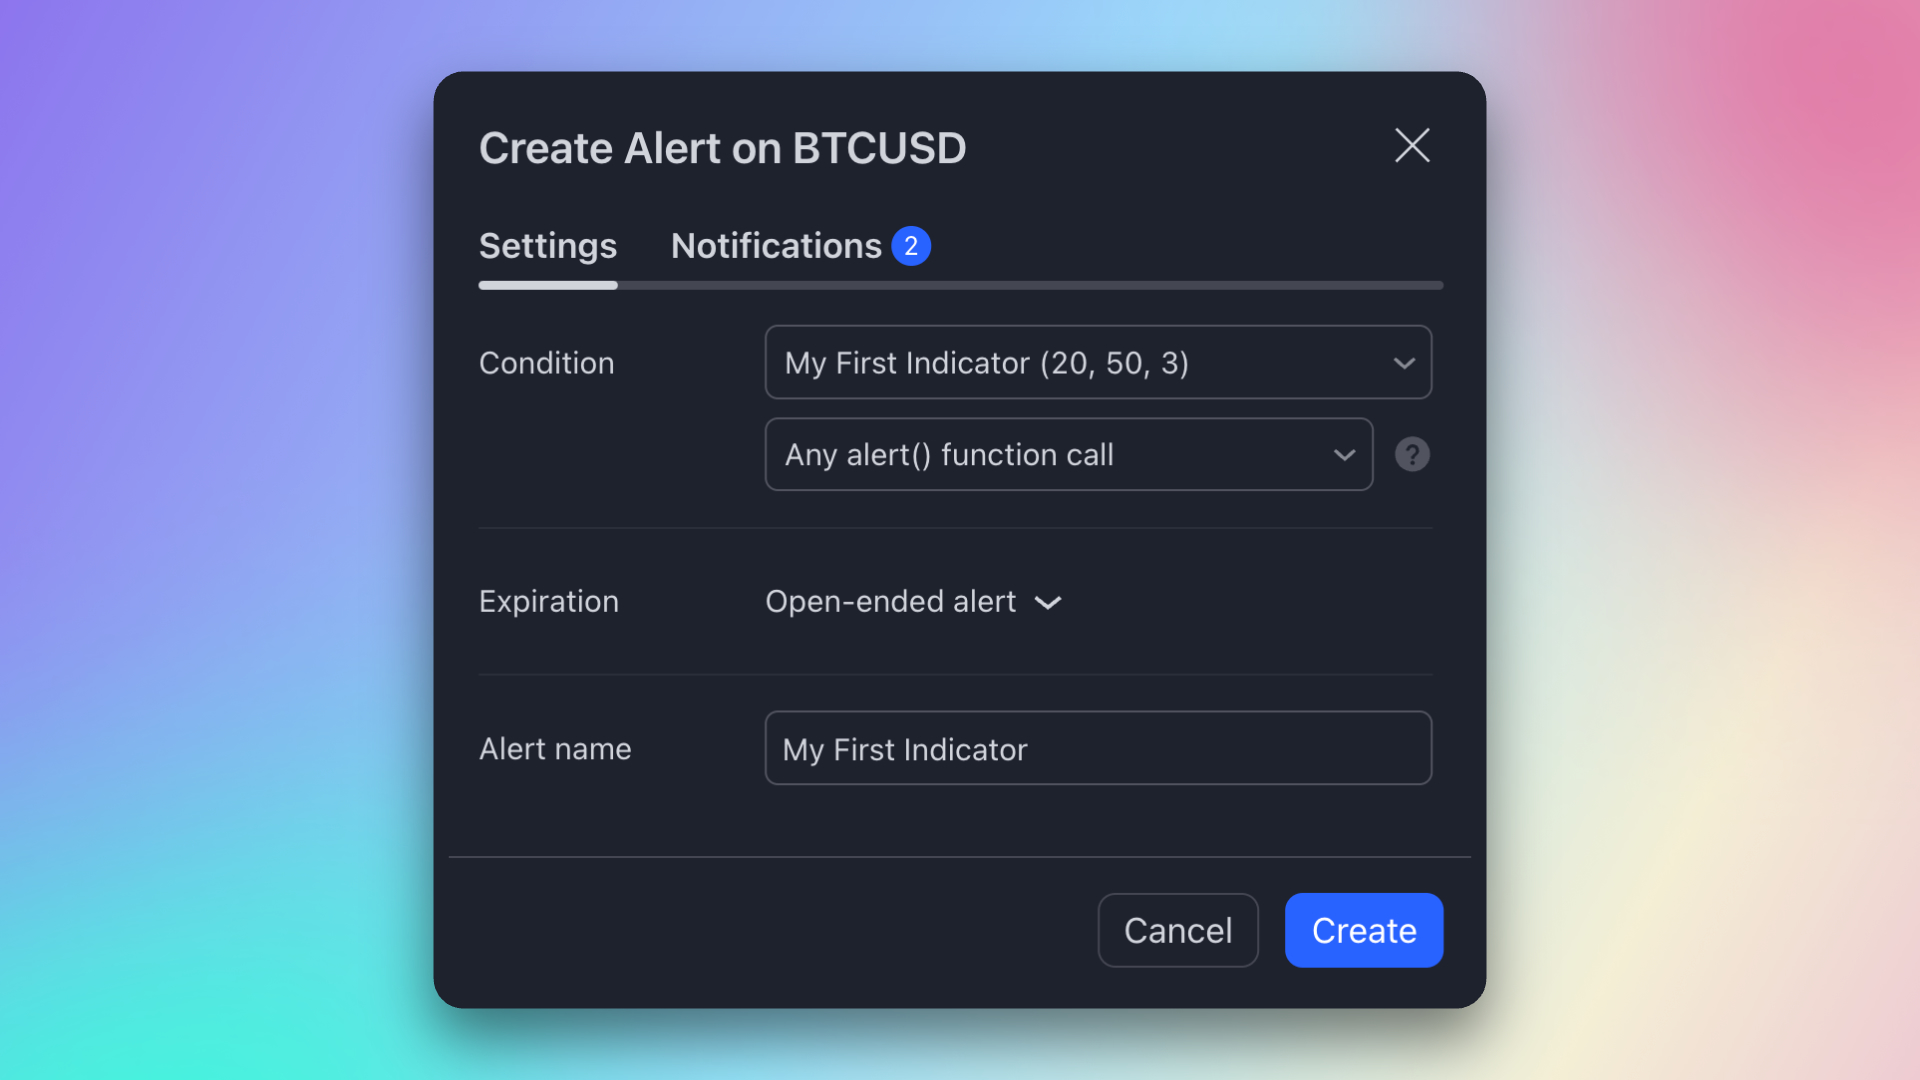
Add alerts on TradingView
Click the 'Create Alert' button in the TradingView toolbar, select the indicator you just created, and select 'Any alert() function call' for the alert, as shown in the figure below.
After creation, you can see the running alerts and corresponding alarm logs in the Alerts panel on the right.
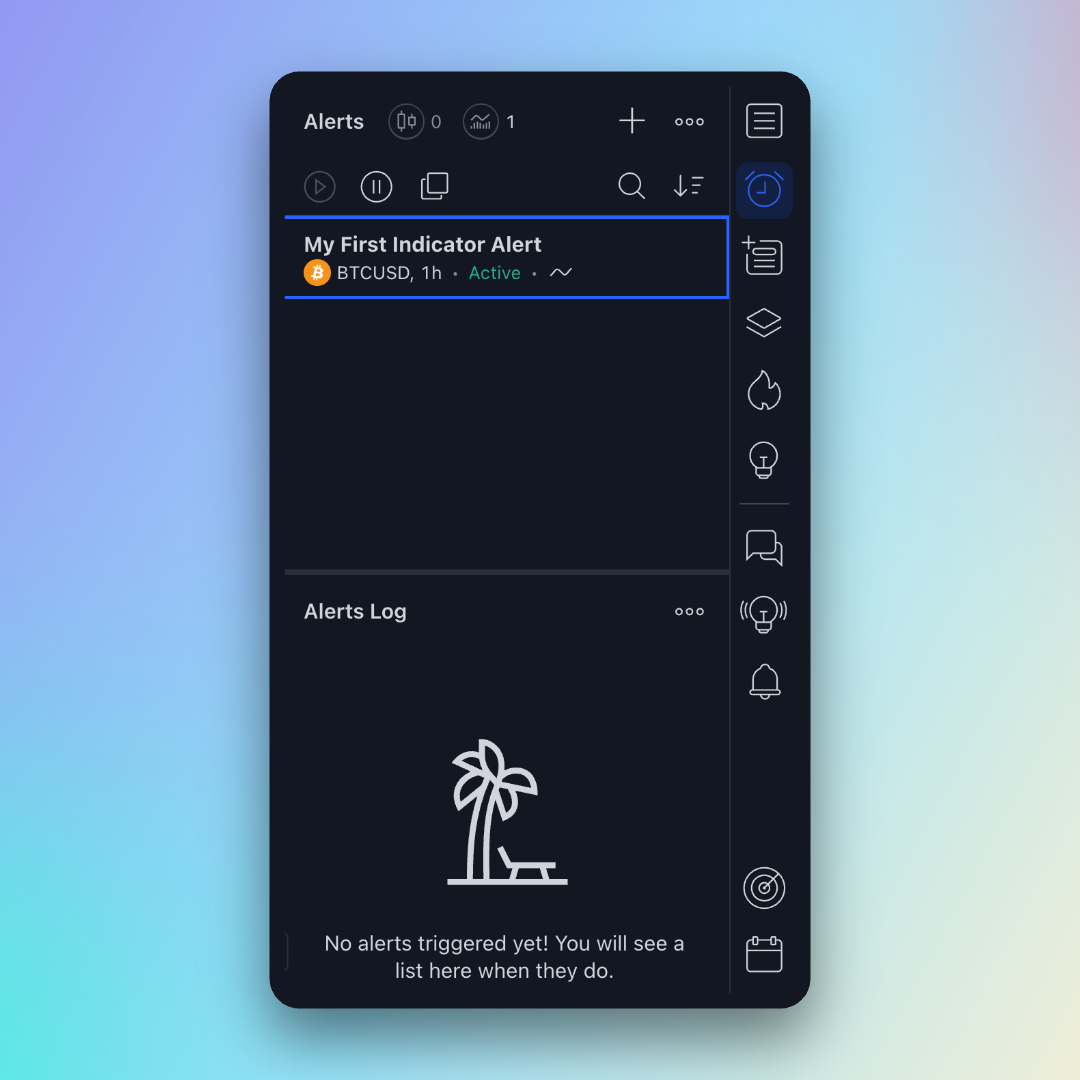
Now, you can receive real-time notifications on emails and Apps when the conditions are met.
🥳 Congratulations! You have successfully created your first indicator. You can now create more complex indicators by combining multiple indicators and conditions.
The functions of Pineify are far more than this, looking forward to you using it to build your own trading indicators.
Next, follow the tutorial to create your first strategy.