Twiggs Money Flow Pine Script — Complete TradingView Guide
The Twiggs Money Flow (TMF) is a volume-weighted oscillator that measures cumulative buying and selling pressure using Wilder's Smoothed Moving Average, producing a signal that oscillates near −1 to +1. Developed by analyst Colin Twiggs as a refined alternative to Chaikin Money Flow, TMF incorporates a true-range adjustment (using the prior close) to reduce distortion caused by overnight gaps. A reading above zero signals net accumulation; a reading below zero signals net distribution. This guide provides the complete Pine Script v6 implementation, a full parameter table, three concrete trading strategies using TMF zero-line crossovers and divergence patterns, and a step-by-step walkthrough for generating a customised TMF indicator instantly with Pineify.
What Is Twiggs Money Flow?
The Twiggs Money Flow (TMF) is a volume-based oscillator that measures the balance of buying and selling pressure by applying Wilder's Smoothed Moving Average to volume-weighted advance/decline data, used to identify accumulation, distribution, and trend confirmation. TMF was developed by Australian analyst Colin Twiggs and published on his Incredible Charts website in the early 2000s. Twiggs designed it as a direct improvement on the Chaikin Money Flow indicator created by Marc Chaikin in the 1980s.
The core insight behind TMF is that a conventional rolling-sum money flow indicator suffers from a "drop-off" distortion: when an old high-volume bar exits the lookback window, the indicator lurches regardless of recent price action. By substituting Wilder's Smoothed Moving Average (WiMA) — also used in RSI and ATR — Twiggs eliminated this artifact and created a smoother, more stable signal.
The calculation uses a true-range–adjusted high and low to account for gap opens:
- TR High =
max(close[1], high) - TR Low =
min(close[1], low) - ADV = volume × ((close − TR Low) − (TR High − close)) / TR Range
- TMF = WiMA(ADV, length) / WiMA(volume, length)
When the close is near the TR High, ADV approaches +volume (strong buying). When the close is near the TR Low, ADV approaches −volume (strong selling). The WiMA smoothing then accumulates this signal over the chosen period, typically 21 bars on daily charts.
TMF is most effective in markets with genuine volume data: US equities, equity futures, and crypto on centralised exchanges. Forex spot markets rely on tick volume as a proxy, reducing signal reliability. The recommended timeframes are Daily and Weekly for swing and position traders, and 1H–4H for active intraday traders using a reduced period of 13–14 bars.
Best Markets
Stocks · Crypto · Futures
Best Timeframes
Daily, Weekly, 4H
Signal Range
−1 to +1 (zero line key)
Twiggs Money Flow Pine Script Code
The code below implements Twiggs Money Flow in Pine Script v6 using Wilder's Smoothed Moving Average applied to true-range–adjusted volume data, then plots the TMF line in a separate pane with a zero reference line. To add it to TradingView, open the Pine Script editor with Alt+P, paste the full code, and click Add to chart. Change the period value 21 to suit your timeframe and trading style.
// This source code is subject to the terms of the Mozilla Public License 2.0 at https://mozilla.org/MPL/2.0/
// © Pineify
//@version=6
indicator(title="Twiggs Money Flow", overlay=false, max_labels_count=500)
// Wilder's Moving Average function
p_ta_WiMA(series float src, simple int len) =>
ma_s = 0.0
ma_s := (src + nz(ma_s[1] * (len - 1))) / len
ma_s
p_ta_tmf(simple int length) =>
// True range calculation
tr_h = math.max(close[1], high)
tr_l = math.min(close[1], low)
tr_c = tr_h - tr_l
// Advance/Decline calculation
adv = volume * ((close - tr_l) - (tr_h - close)) / (tr_c == 0 ? 9999999 : tr_c)
// Volume calculations
wv = volume + (volume[1] * 0)
wmV = p_ta_WiMA(wv, length)
wmA = p_ta_WiMA(adv, length)
// Twiggs Money Flow
tmf = wmV == 0 ? 0 : wmA / wmV
tmf
// Calculate TMF with default period of 21
p_ind_1 = p_ta_tmf(21)
// Plot the TMF line
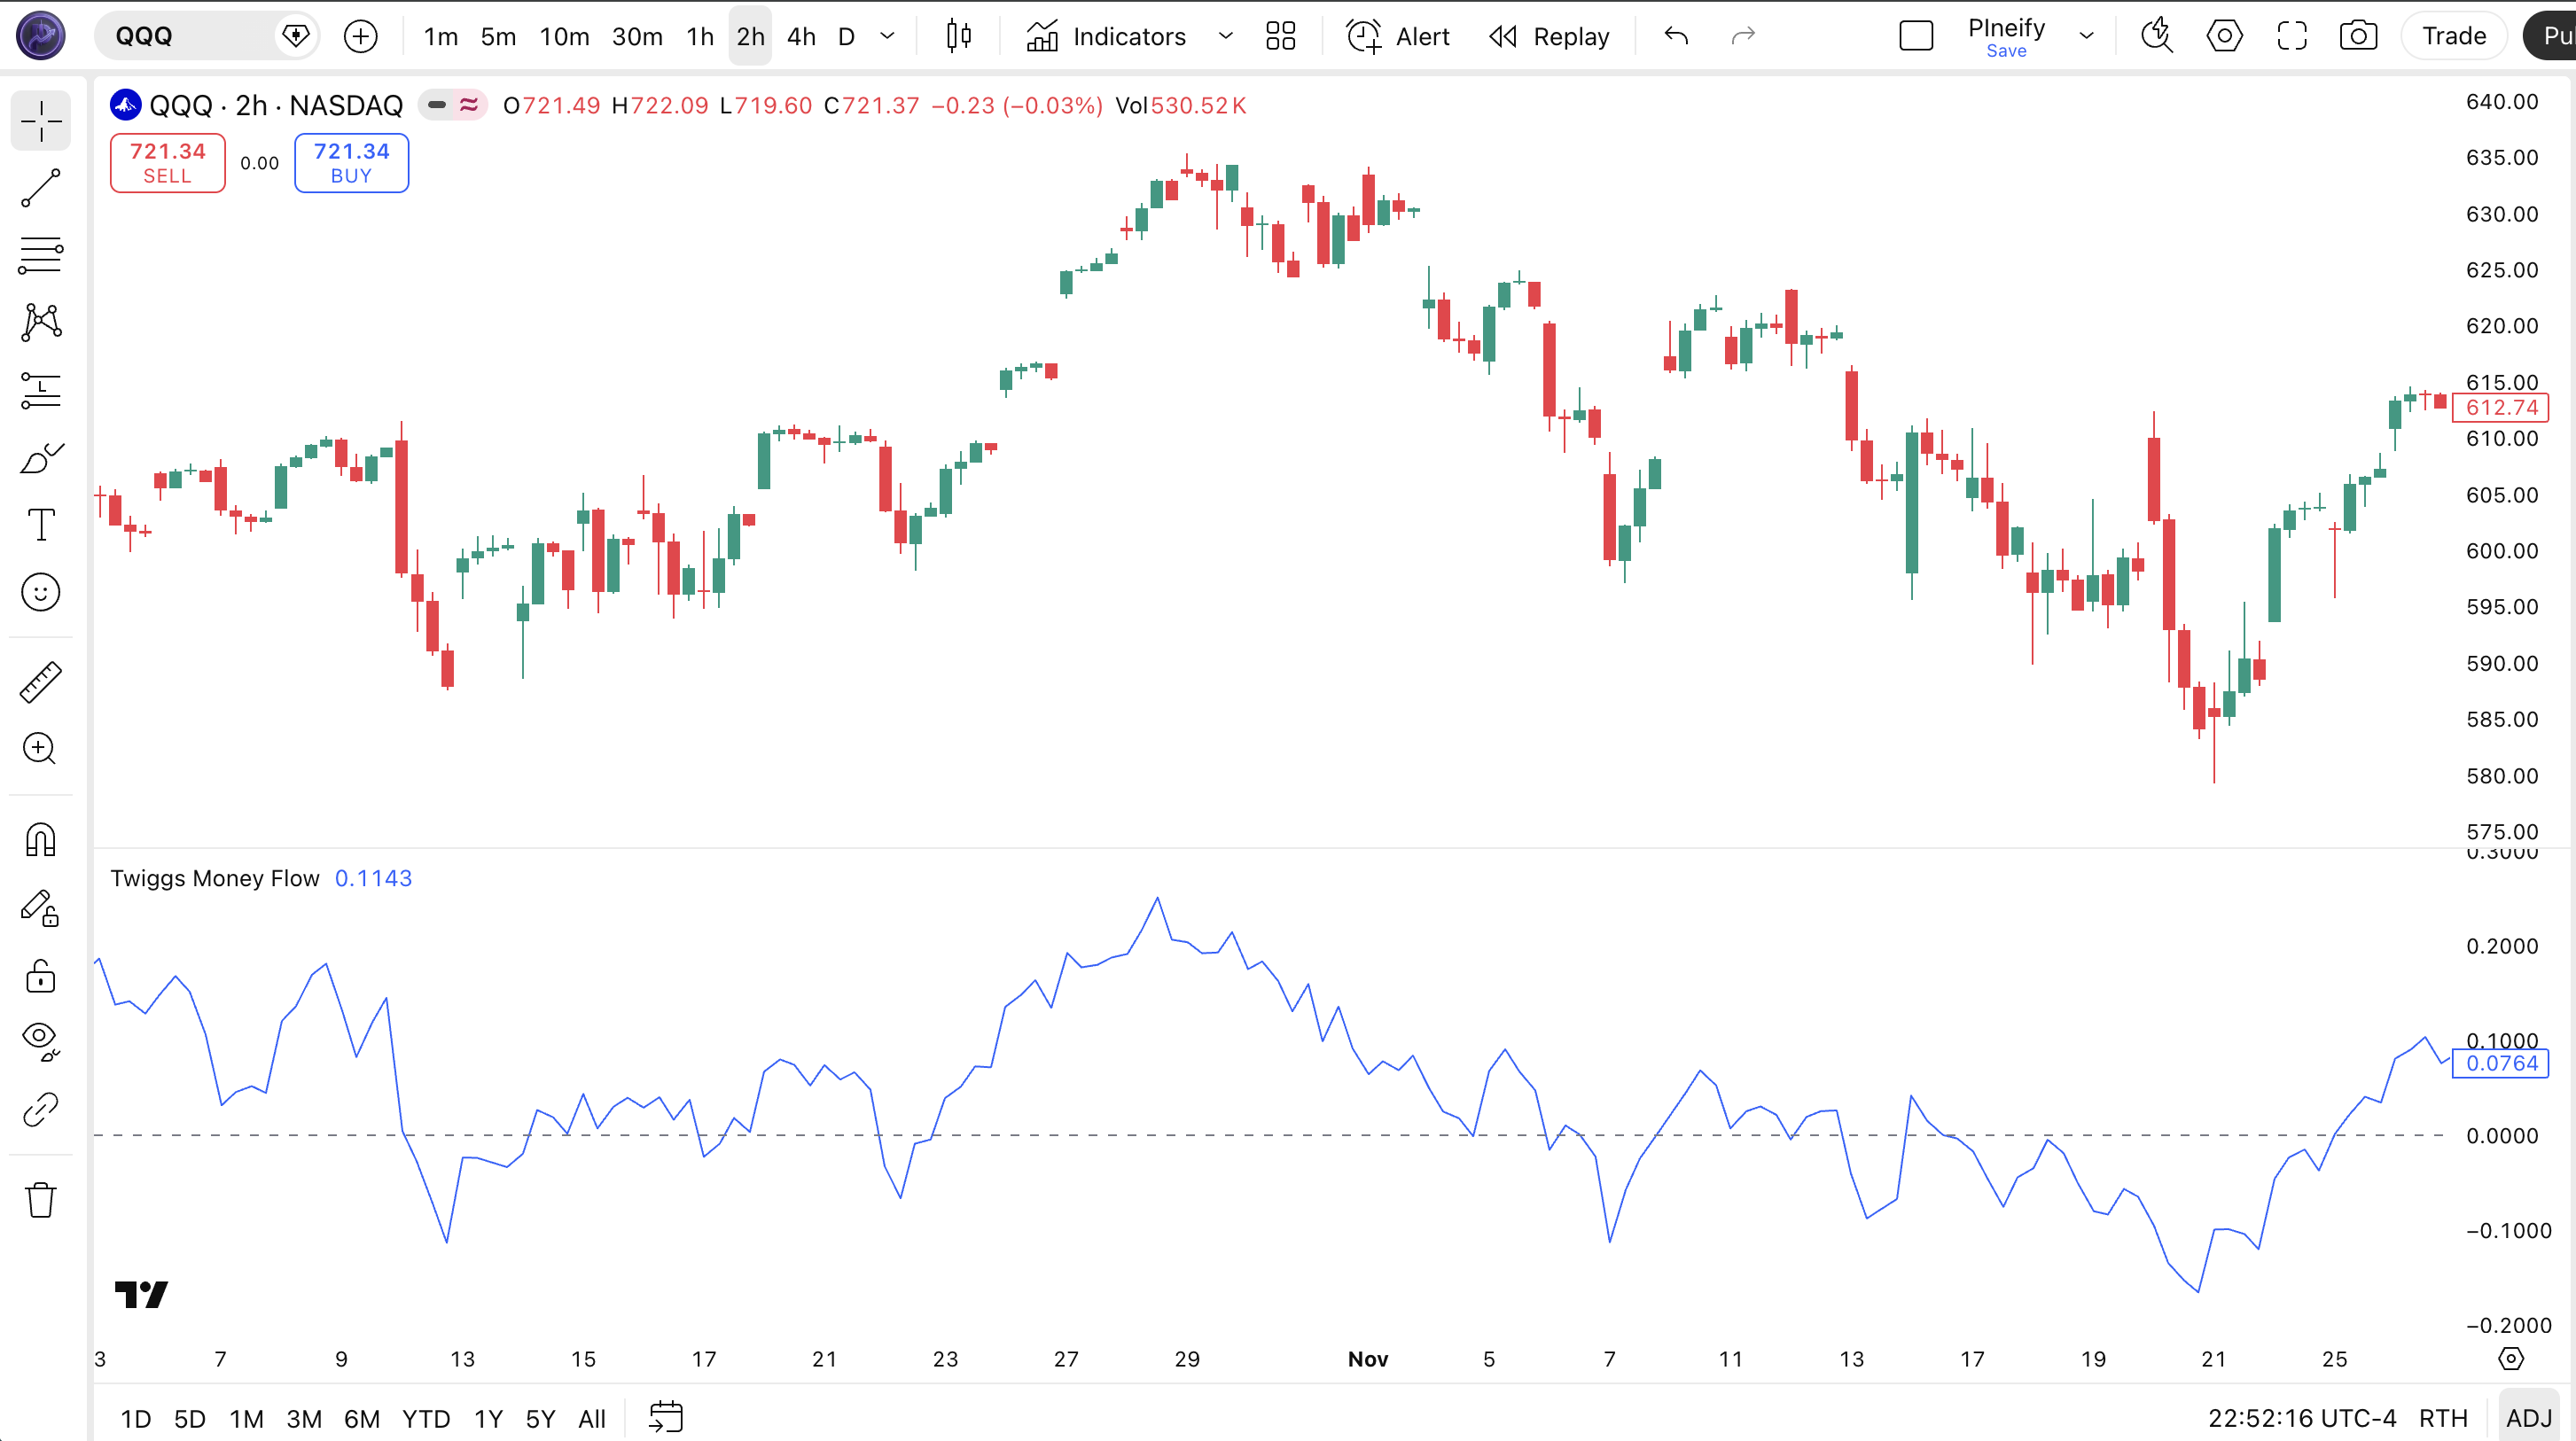
plot(p_ind_1, "TMF", color.rgb(41, 98, 255, 0), 1)
hline(0, title="TMF - Zero", color=#787B86)Chart Preview
Twiggs Money Flow Parameters
| Parameter | Default Value | Description | Recommended Range |
|---|---|---|---|
| length | 21 | Number of bars used in Wilder's Smoothed Moving Average for both the advance/decline money flow and volume. A larger value produces a smoother, slower-reacting TMF line with fewer false crossovers. | 13–34 depending on timeframe |
| source (close) | close | The closing price used to measure where the bar closed relative to its true range. The formula requires close specifically — changing this to hlc3 alters the indicator semantics. | close (standard) |
| volume | volume | The volume series used to weight the advance/decline calculation. In Pine Script v6, the built-in volume series is used automatically. On forex instruments, this represents tick volume. | volume (built-in) |
| zero line | 0 | The reference line at zero. TMF crossing above 0 signals net accumulation (bullish); crossing below 0 signals net distribution (bearish). This is the primary decision threshold for TMF-based strategies. | Fixed at 0 |
Tuning Guide by Trading Style
- Day trading (1H–4H charts): length 13–14 — faster response to intraday money flow shifts; use zero-line crossovers as primary entry signals
- Swing trading (Daily charts): length 21 — Colin Twiggs' original recommendation; balances sensitivity and noise reduction for daily price action
- Position trading (Weekly charts): length 21–34 — slower signal suited for multi-week trend confirmation; combine with a 200-bar EMA trend filter
Trading Strategies Using Twiggs Money Flow
Twiggs Money Flow generates the most reliable signals when used as a trend confirmation tool in conjunction with price structure analysis. The three strategies below provide specific entry and exit conditions with concrete indicator combinations.
Strategy 1 — TMF Zero-Line Crossover Trend Entry
Market environment: trending markets · Best timeframe: Daily, 4H
This strategy enters long trades when TMF confirms a bullish trend by crossing above the zero line, filtered by a 200-bar EMA to ensure alignment with the macro trend. Pair TMF with ta.ema(close, 200) as the trend filter.
- Calculate TMF with period 21:
tmf = p_ta_tmf(21) - Calculate trend filter:
ema200 = ta.ema(close, 200) - Long entry: TMF crosses above 0 (
ta.crossover(tmf, 0)) AND close > ema200 - Stop loss: below the most recent swing low (prior 10 bars)
- Exit: TMF crosses below 0, or price closes below the 200 EMA
Strategy 2 — TMF Bullish Divergence Reversal
Market environment: downtrend nearing exhaustion · Best timeframe: Daily
Bullish divergence between price and TMF — price makes a lower low while TMF makes a higher low — signals that selling volume is declining despite falling prices. Combine with RSI below 40 to confirm oversold conditions before entering.
- Price swing low lower than prior swing low:
low < low[10] - TMF higher than its prior value:
tmf > tmf[10] - Confirm with RSI:
ta.rsi(close, 14) < 40 - Long entry: all three conditions met on the same bar or within 2 bars
- Stop loss: 1 ATR(14) below the divergence low; Target: 2:1 reward-to-risk, or exit when TMF crosses above +0.10
Strategy 3 — TMF Distribution + MACD Bearish Confirmation
Market environment: uptrend showing distribution signs · Best timeframe: Daily, 4H
Combining TMF zero-line crossdowns with a bearish MACD histogram provides high-probability short signals. When distribution (TMF below 0) aligns with negative MACD momentum, the probability of a sustained decline increases significantly.
- TMF crosses below zero:
ta.crossunder(tmf, 0) - MACD histogram is negative:
ta.macd(close, 12, 26, 9) histogram < 0 - Price is below the 50-bar EMA:
close < ta.ema(close, 50) - Short entry: all three conditions align within 2 bars
- Stop loss: above the recent swing high (prior 5 bars) + 0.5 ATR buffer; Exit: TMF crosses back above 0 or price recaptures the 50 EMA
Disclaimer: The strategies above are for educational purposes only and do not constitute investment advice. Past performance does not guarantee future results. Always apply proper risk management and position sizing.
How to Generate Twiggs Money Flow in Pineify
- 1
Open Pineify
Go to pineify.app and sign in — a free account gives you access to all built-in indicator generators including Twiggs Money Flow.
- 2
Click "New Indicator"
Select "Indicator" as the script type from the creation menu to start with a clean Pine Script v6 template.
- 3
Describe the Twiggs Money Flow configuration you need
Type a prompt such as: "Add a Twiggs Money Flow indicator with period 21, plot the TMF line in a separate pane, add a zero reference line, and trigger an alert when TMF crosses above or below zero." Pineify's AI Coding Agent generates the complete Pine Script v6 code instantly.
- 4
Copy the generated code to TradingView
Click "Copy to TradingView" to copy the code, then paste it into the TradingView Pine Script editor (Alt+P) and click "Add to chart". The TMF panel appears immediately below the price chart with the zero reference line.
- 5
Adjust the period in the indicator settings
Open the indicator settings panel in TradingView to change the TMF period from the default 21 to any value that suits your trading style and timeframe — no code editing required.
Frequently Asked Questions
Related Pine Script Indicators
Build Your Twiggs Money Flow Indicator in Seconds
Skip the manual coding. Pineify's AI Coding Agent generates complete, ready-to-use Pine Script indicators — including Twiggs Money Flow with zero-line alerts and divergence detection — instantly for free.
Try Pineify Free