Volume SuperTrend AI: KNN Labels, Signals and Testing Limits

Volume SuperTrend AI combines a volume-weighted price basis, ATR-based trend bands and a nearest-neighbor label calculation. In Pineify’s implementation, the label is a weighted classification of recent observations, not a calibrated probability that a trade will win.
Follow the calculation
The selected moving-average method forms a ratio of smoothed price-times-volume to smoothed volume. ATR and the factor then define Supertrend-style bands with persistent band and direction logic. The volume feed must be meaningful; missing or zero volume can make the ratio unavailable.
The KNN step compares the current Supertrend value with recent Supertrend values by absolute distance. Historical labels come from whether a smoothed price series exceeds a smoothed Supertrend series. The nearest labels are weighted by inverse distance.
The sample includes the current observation. Consequently, this is not an out-of-sample forecasting experiment, and its label should not be presented as measured prediction accuracy. The Price Trend and Prediction Trend inputs are smoothing lengths, not separate chart timeframes or historical search horizons.
What the colors and shapes mean
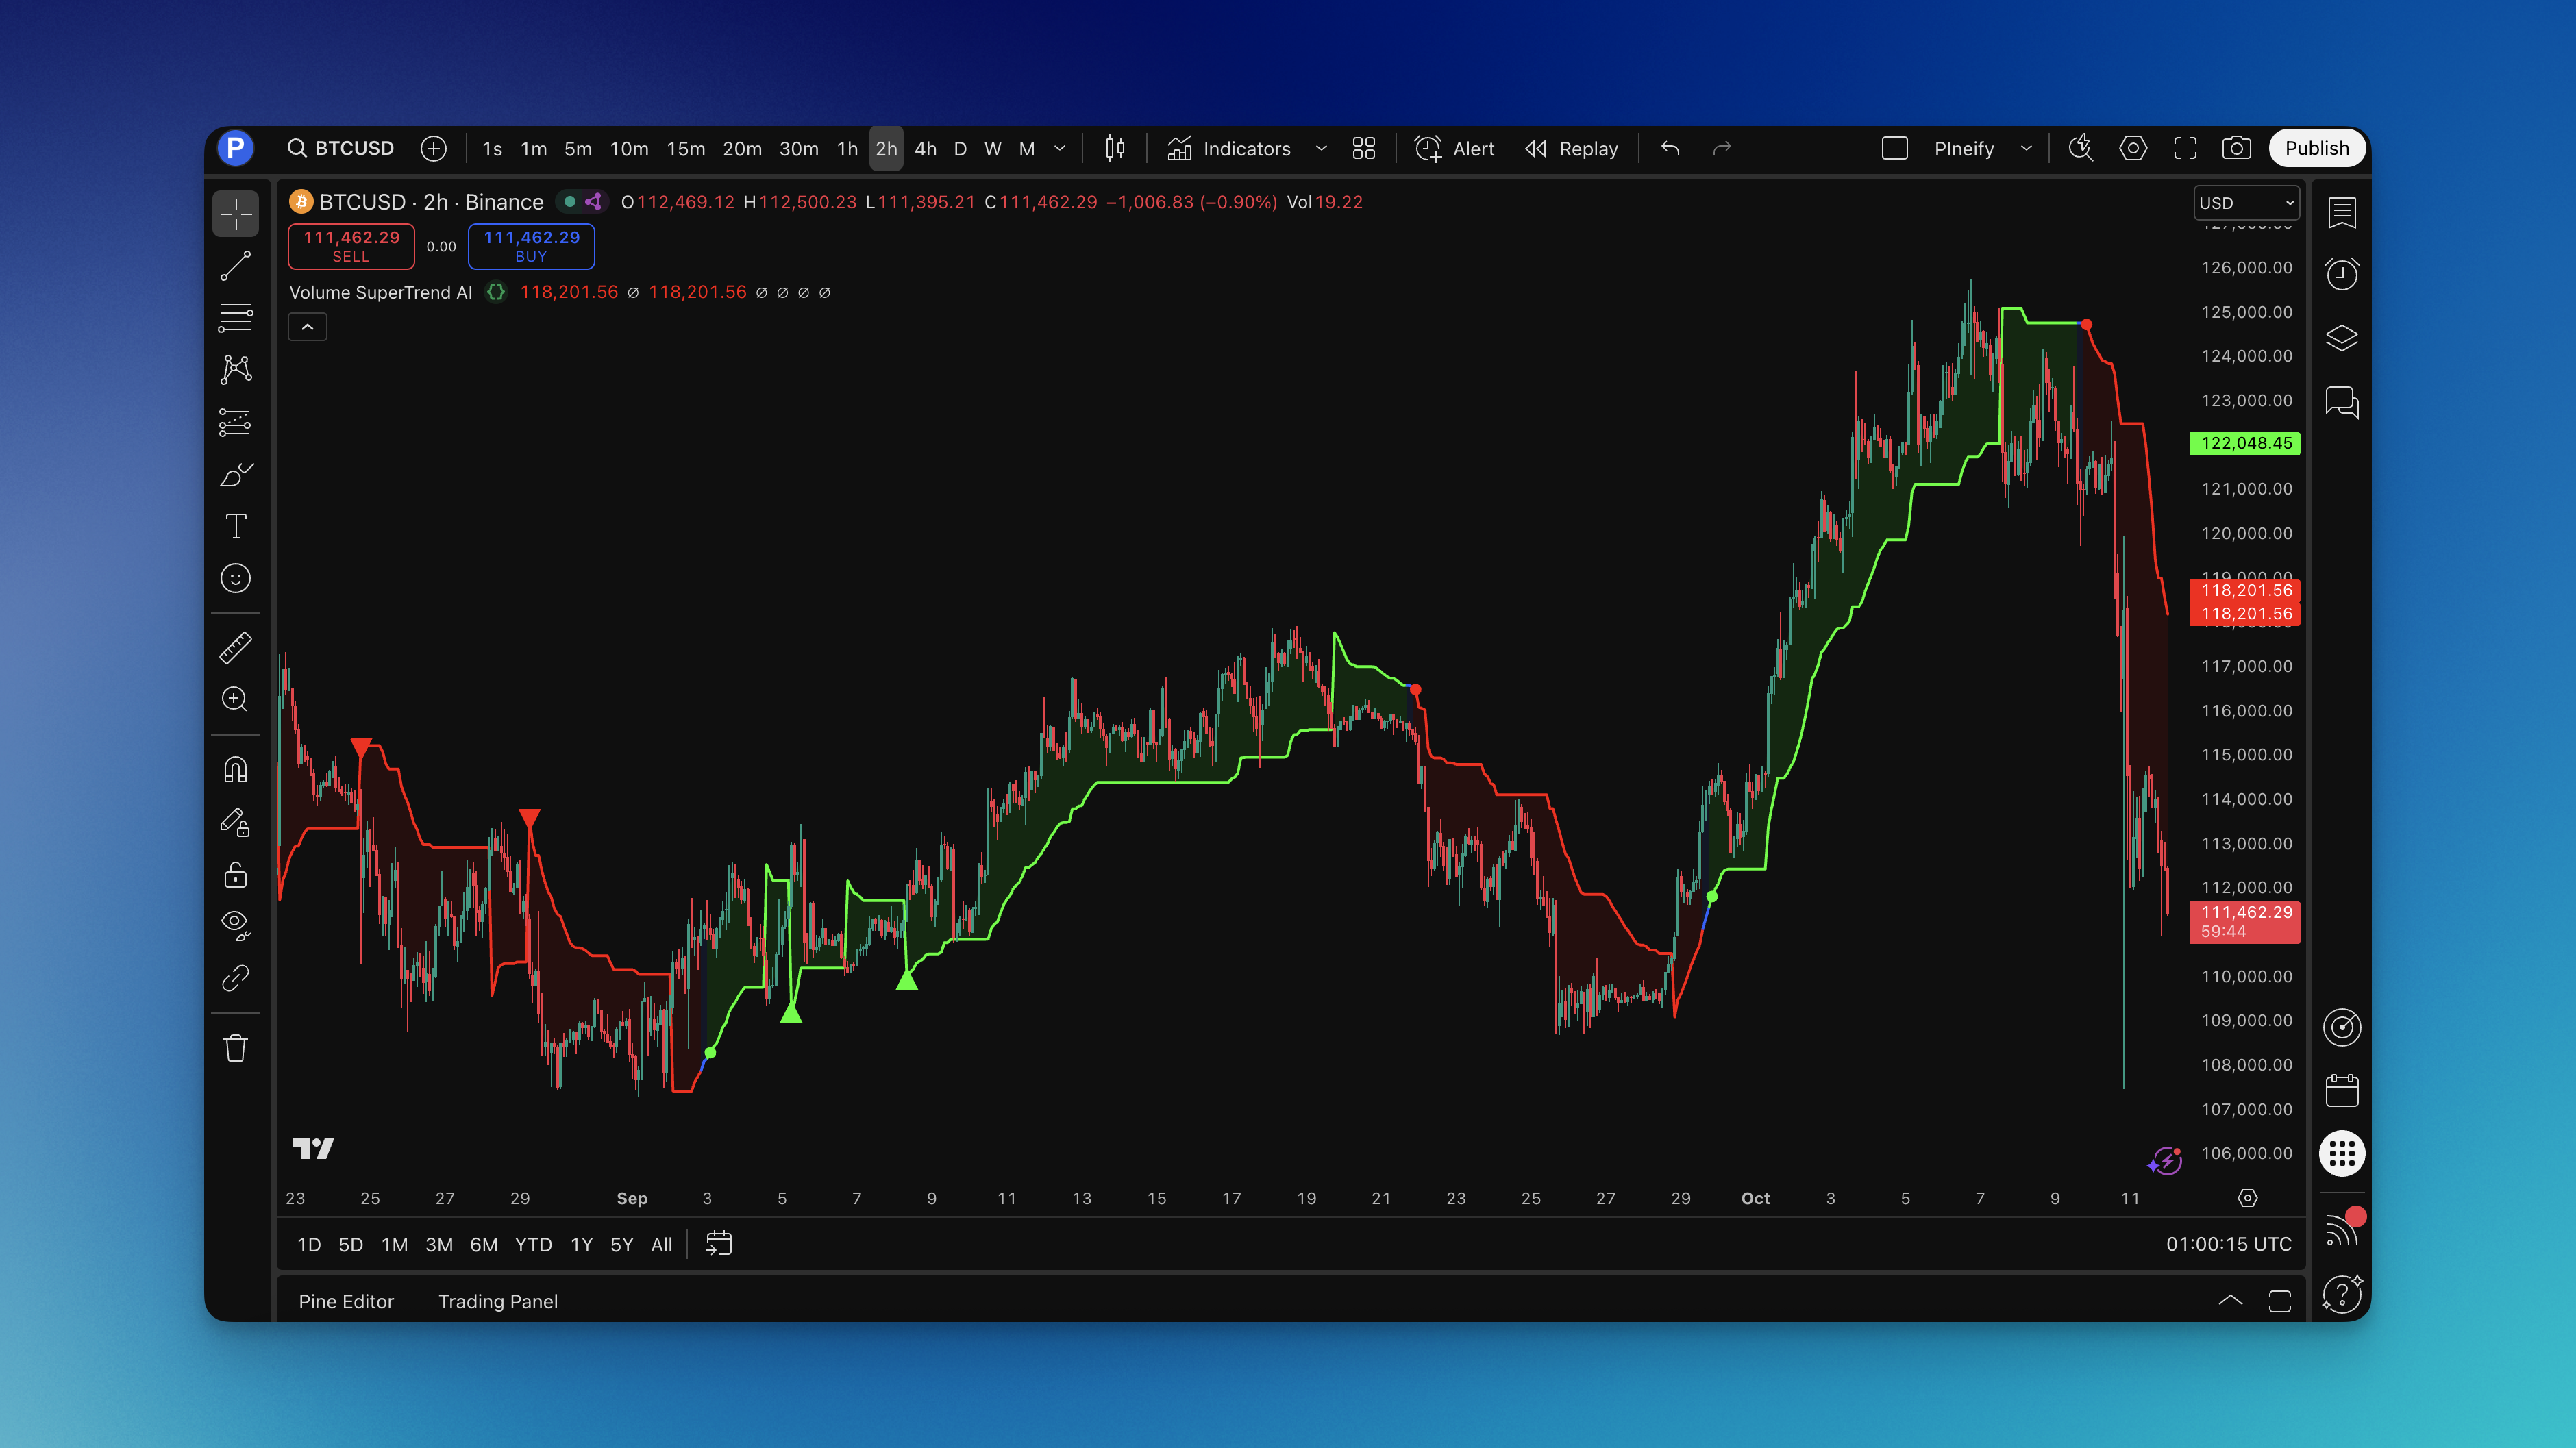
The drawing uses green when the label equals 1, red when it equals 0, and the neutral color otherwise. A mixed weighted result is not a separately calibrated “unsafe market” probability. The neutral display can also cover unavailable results, so inspect warm-up and data quality before treating it as a market regime.
Circles mark transitions into an endpoint label. Triangles additionally require the corresponding Supertrend direction flip. That conjunction is a different event, not proof of higher expected profit. There is no evidence here supporting larger positions on triangles.
Default inputs and access
The registered defaults are 3 neighbors, 10 data observations, Price Trend 20, Prediction Trend 100, ATR/basis length 10, factor 3 and WMA smoothing. The implementation ensures the sample size is at least the neighbor count. The component is marked paid in Pineify’s catalog.
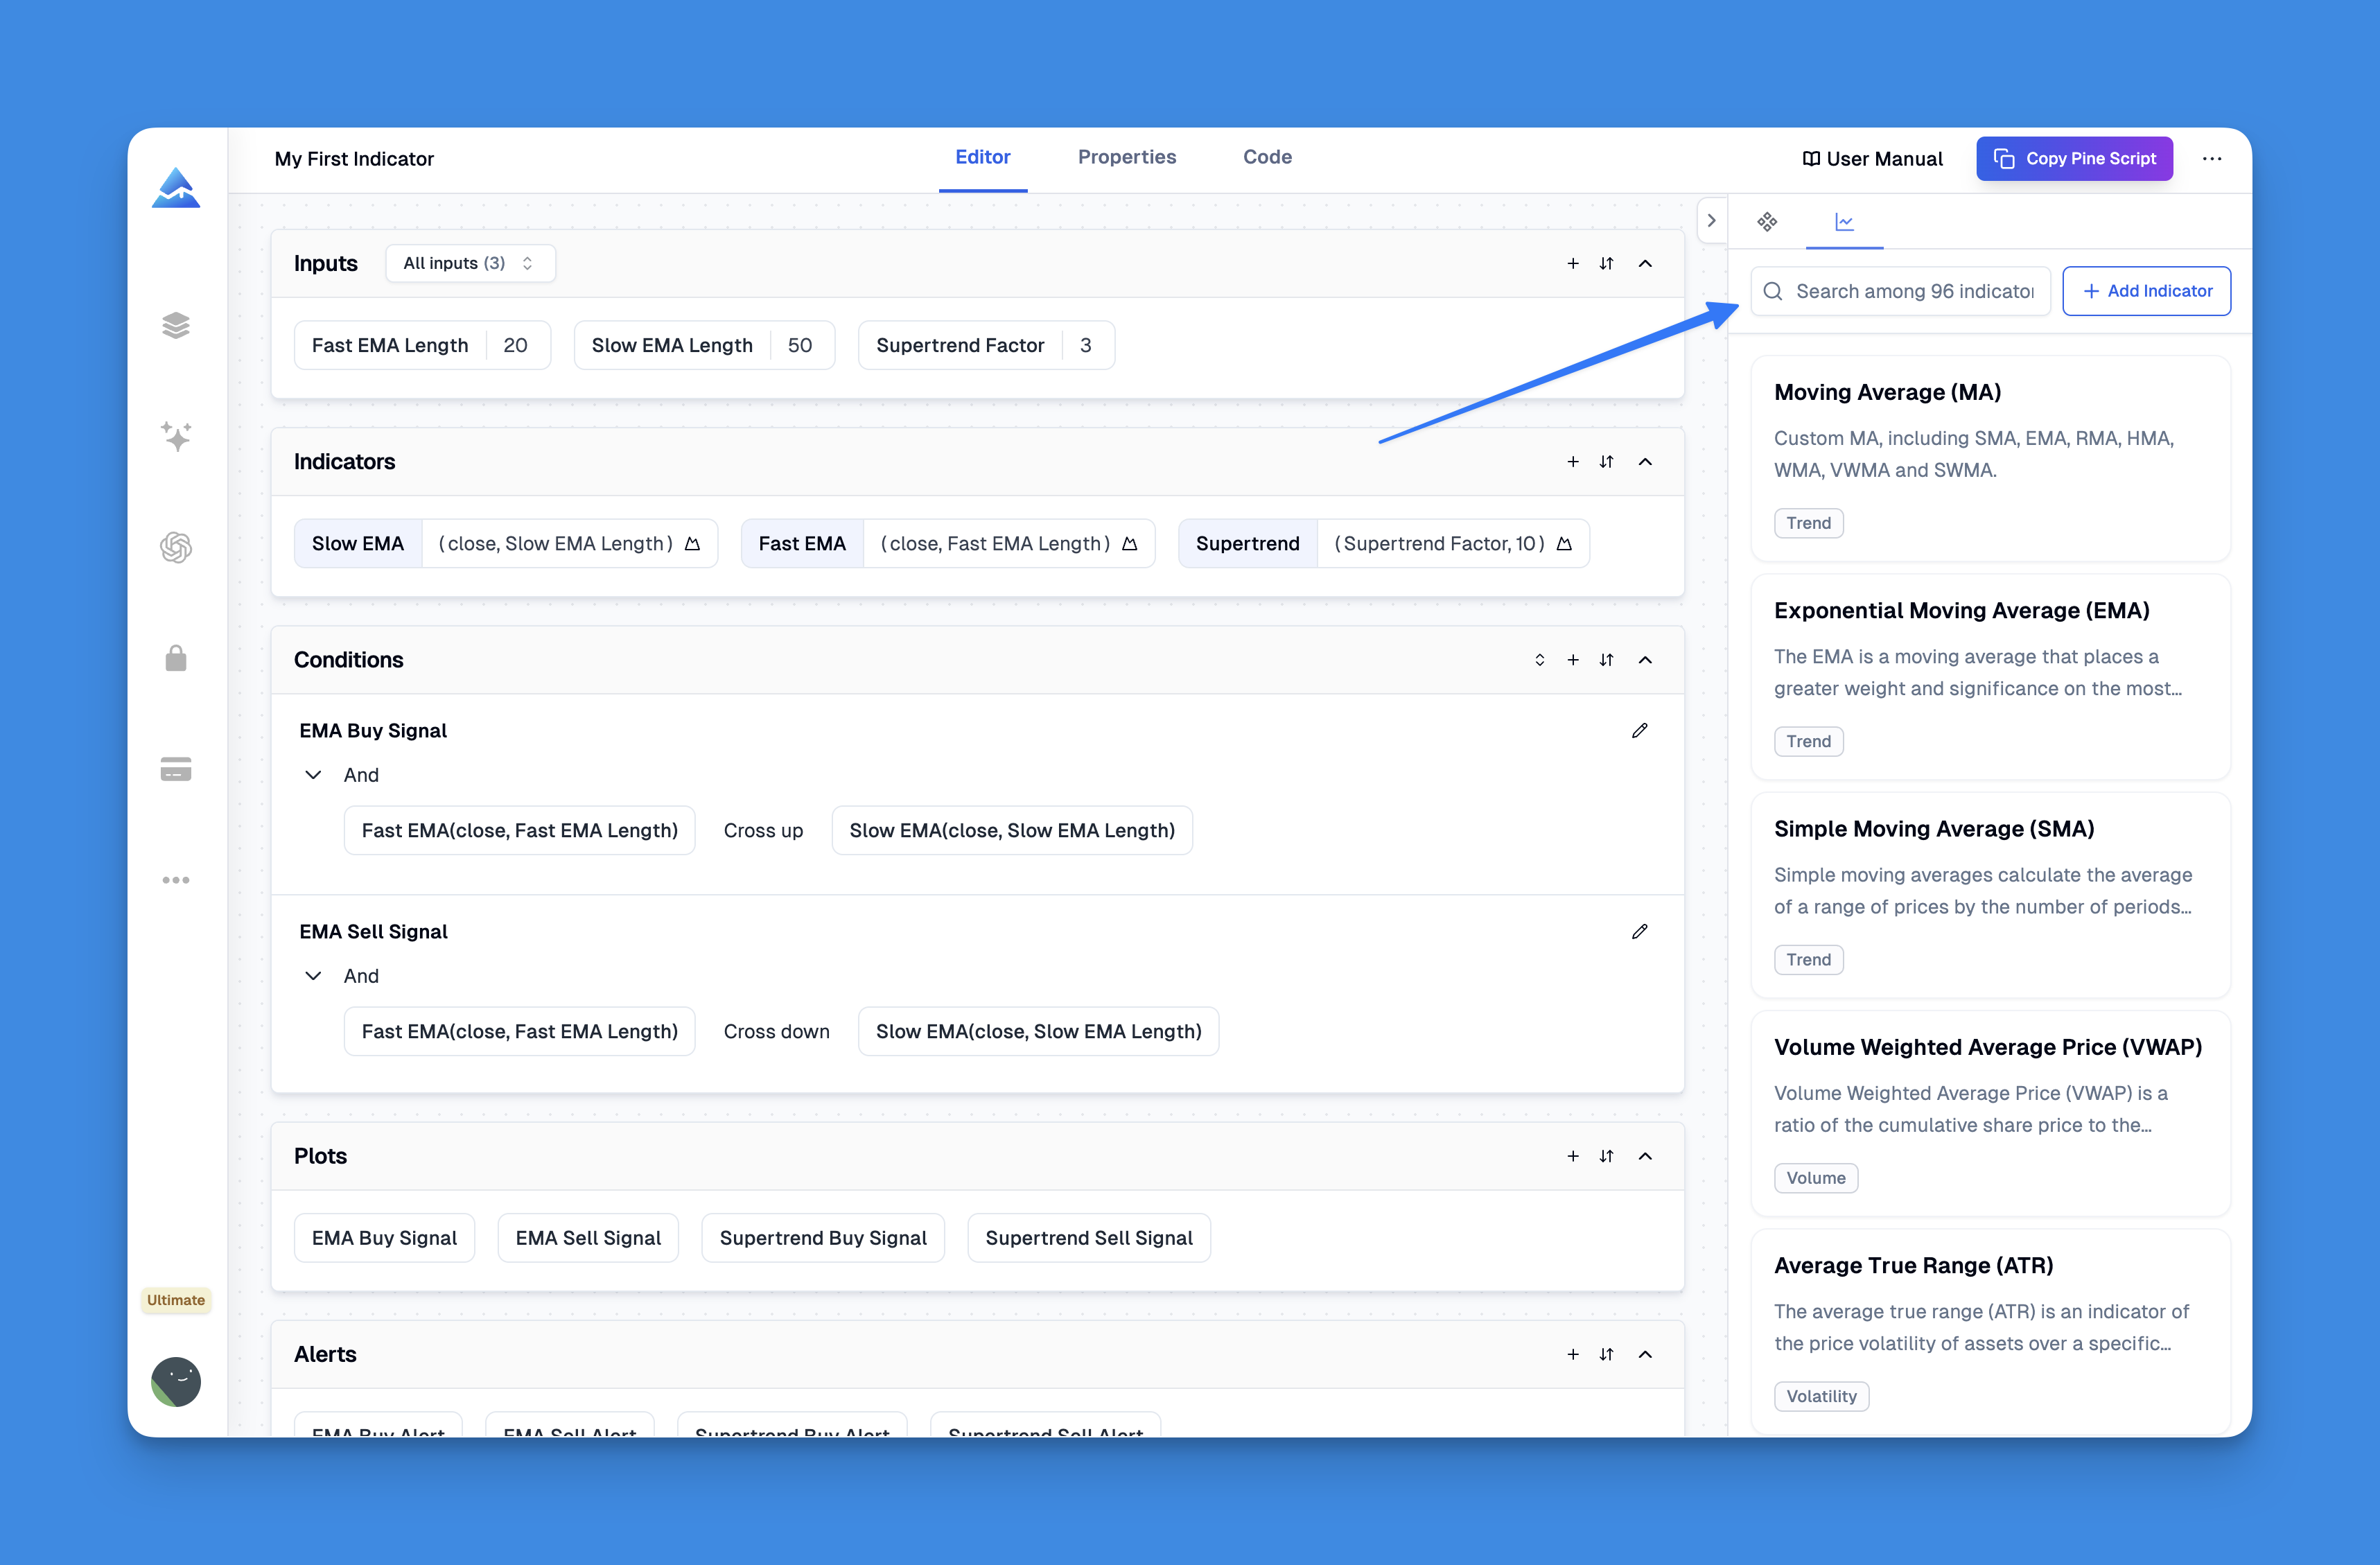
Open the visual editor, select the component and inspect the generated output in TradingView. Adequate warm-up depends on all calculations, including the 100-bar smoothing; ten observations alone are not sufficient proof that every input is valid.
Realtime behavior and evaluation
The calculation uses the current close and volume and has no unconditional closed-bar confirmation gate. Its current label and signal can therefore change on an open bar. Waiting for a closed-bar alert can change timing, and higher-timeframe requests require their own confirmation policy.
For a strategy test, specify which boolean signal triggers an entry, order timing, exits, costs and position sizing. Compare it with an ordinary Supertrend using identical assumptions and a separate evaluation period. Also inspect missing-volume symbols and periods with frequent band flips.
The previous SPY 62% versus 51% win rates, profit factors, drawdowns, 47-versus-89 trades and EURUSD forward-test results had no reproducible records. The title’s “AI” does not validate any of those claims.
Implementation reviewed October 20, 2026. Related platform limits: Pine repainting documentation.