Godmode Indicator Alternatives: Upgrade to Pineify Signals
If you're trading with the Godmode Indicator on TradingView but dealing with false signals and messy charts, I've been there too. After testing half a dozen alternatives, Pineify Signals & Overlays is the upgrade I'd recommend — it's an invite-only indicator that checks trend, momentum, and volatility before flashing a signal. Confluence-based signals require multiple confirming factors to align before a trade setup is shown, which filters out the noise that single-oscillator tools struggle with.
The Godmode Indicator and Its Limits
The Godmode Indicator is a free, open-source TradingView script that combines WaveTrend momentum with RSI overbought/oversold levels and tries to mark support and resistance zones. It's been updated several times with supply-and-demand features and has a loyal following among crypto and forex traders.
Being open-source and free means a lot of people use it. That community is helpful, but when thousands of traders watch the same crossovers, those signals lose edge. The core method relies on line crossovers, which tend to fire false entries in sideways or rangebound markets. I tested it on BTC/USD during the March 2024 consolidation and got three false longs in five days — that's when I started looking for something else.
Why Traders Move Past Godmode
The frustrations pile up gradually. Here's what typically pushes people to explore Godmode Indicator alternatives:
- False signals pile up. It works in a clean trend but falls apart in chop. Each bad entry eats into your account.
- No multi-timeframe check. To see if a 5-minute signal aligns with the 1-hour chart, you're switching tabs constantly. I prefer tools that do this automatically.
- Alerts are all-or-nothing. You either get pinged for every crossover or you watch the screen. There's no filter separating high-probability setups from noise. If you're looking to understand TradingView's alert system better, here's a guide on How to Set TradingView Alerts.
- Signal saturation. Open-source scripts get copied everywhere. When everyone sees the same thing, its predictive value drops.
- No confluence filter. The indicator looks at one dimension. It doesn't cross-check volume, structure, or volatility for confirmation.
These are not unique to Godmode. They apply to most single-layer open-source tools. They give you one data point and leave you to assemble the rest.
This gap is why curated, confluence-based tools are gaining traction. Traders want a system that cross-references multiple factors automatically. Pineify Signals & Overlays was built for exactly that — to reduce false signals by requiring alignment across trend, momentum, and volatility before triggering.

Beyond the indicator itself, Pineify gives you a Visual Editor to build strategies without code, an AI Coding Agent that generates error-free Pine Script, and the AI Stock Picker for data-driven trade ideas. Signals & Overlays is part of this ecosystem, designed to layer multi-timeframe confluence on top of 235+ available indicators. I've found the AI agent particularly useful — I wrote a custom volatility filter in under two minutes that would've taken me an hour by hand. Before deploying any tool, I always run my strategy through backtesting first.
How Pineify Signals & Overlays Works
Think of it as a personal chart filter. Instead of signaling based on one data point, it waits for several conditions to line up first.
The core logic: a signal fires only when trend direction, momentum strength, and market volatility agree. This three-factor check is meant to filter out marginal setups so you're only seeing higher-probability opportunities.
Access is by invitation only, tied to certain subscription levels. This limits the user pool and helps the tool's signals stay effective. The community has grown to over 100,000 active traders. Backtesting data from the creator shows an 87% historical win rate across markets and timeframes, with the best single trade returning 412%.
I'll be upfront about one limitation: I haven't personally verified those backtest numbers. Past performance doesn't guarantee future results, and the 87% figure assumes you take every signal — which most traders don't. I'd recommend running your own forward test before committing real capital.
Multi-Factor Signal Confirmation
Rather than relying on one analysis type, the tool examines each price bar from three angles: overall trend, momentum power, and market volatility. A signal pops up only when all three agree. This multi-factor approach is the same method professional traders use to filter for high-probability setups.
Automatic Timeframe Alignment
One feature I genuinely appreciate: it checks the higher timeframe trend (say, the daily chart) and compares it with signals on your current chart. This stops you from taking a short-term buy signal when the daily trend is still bearish — a mistake I've made more times than I'd like to admit.
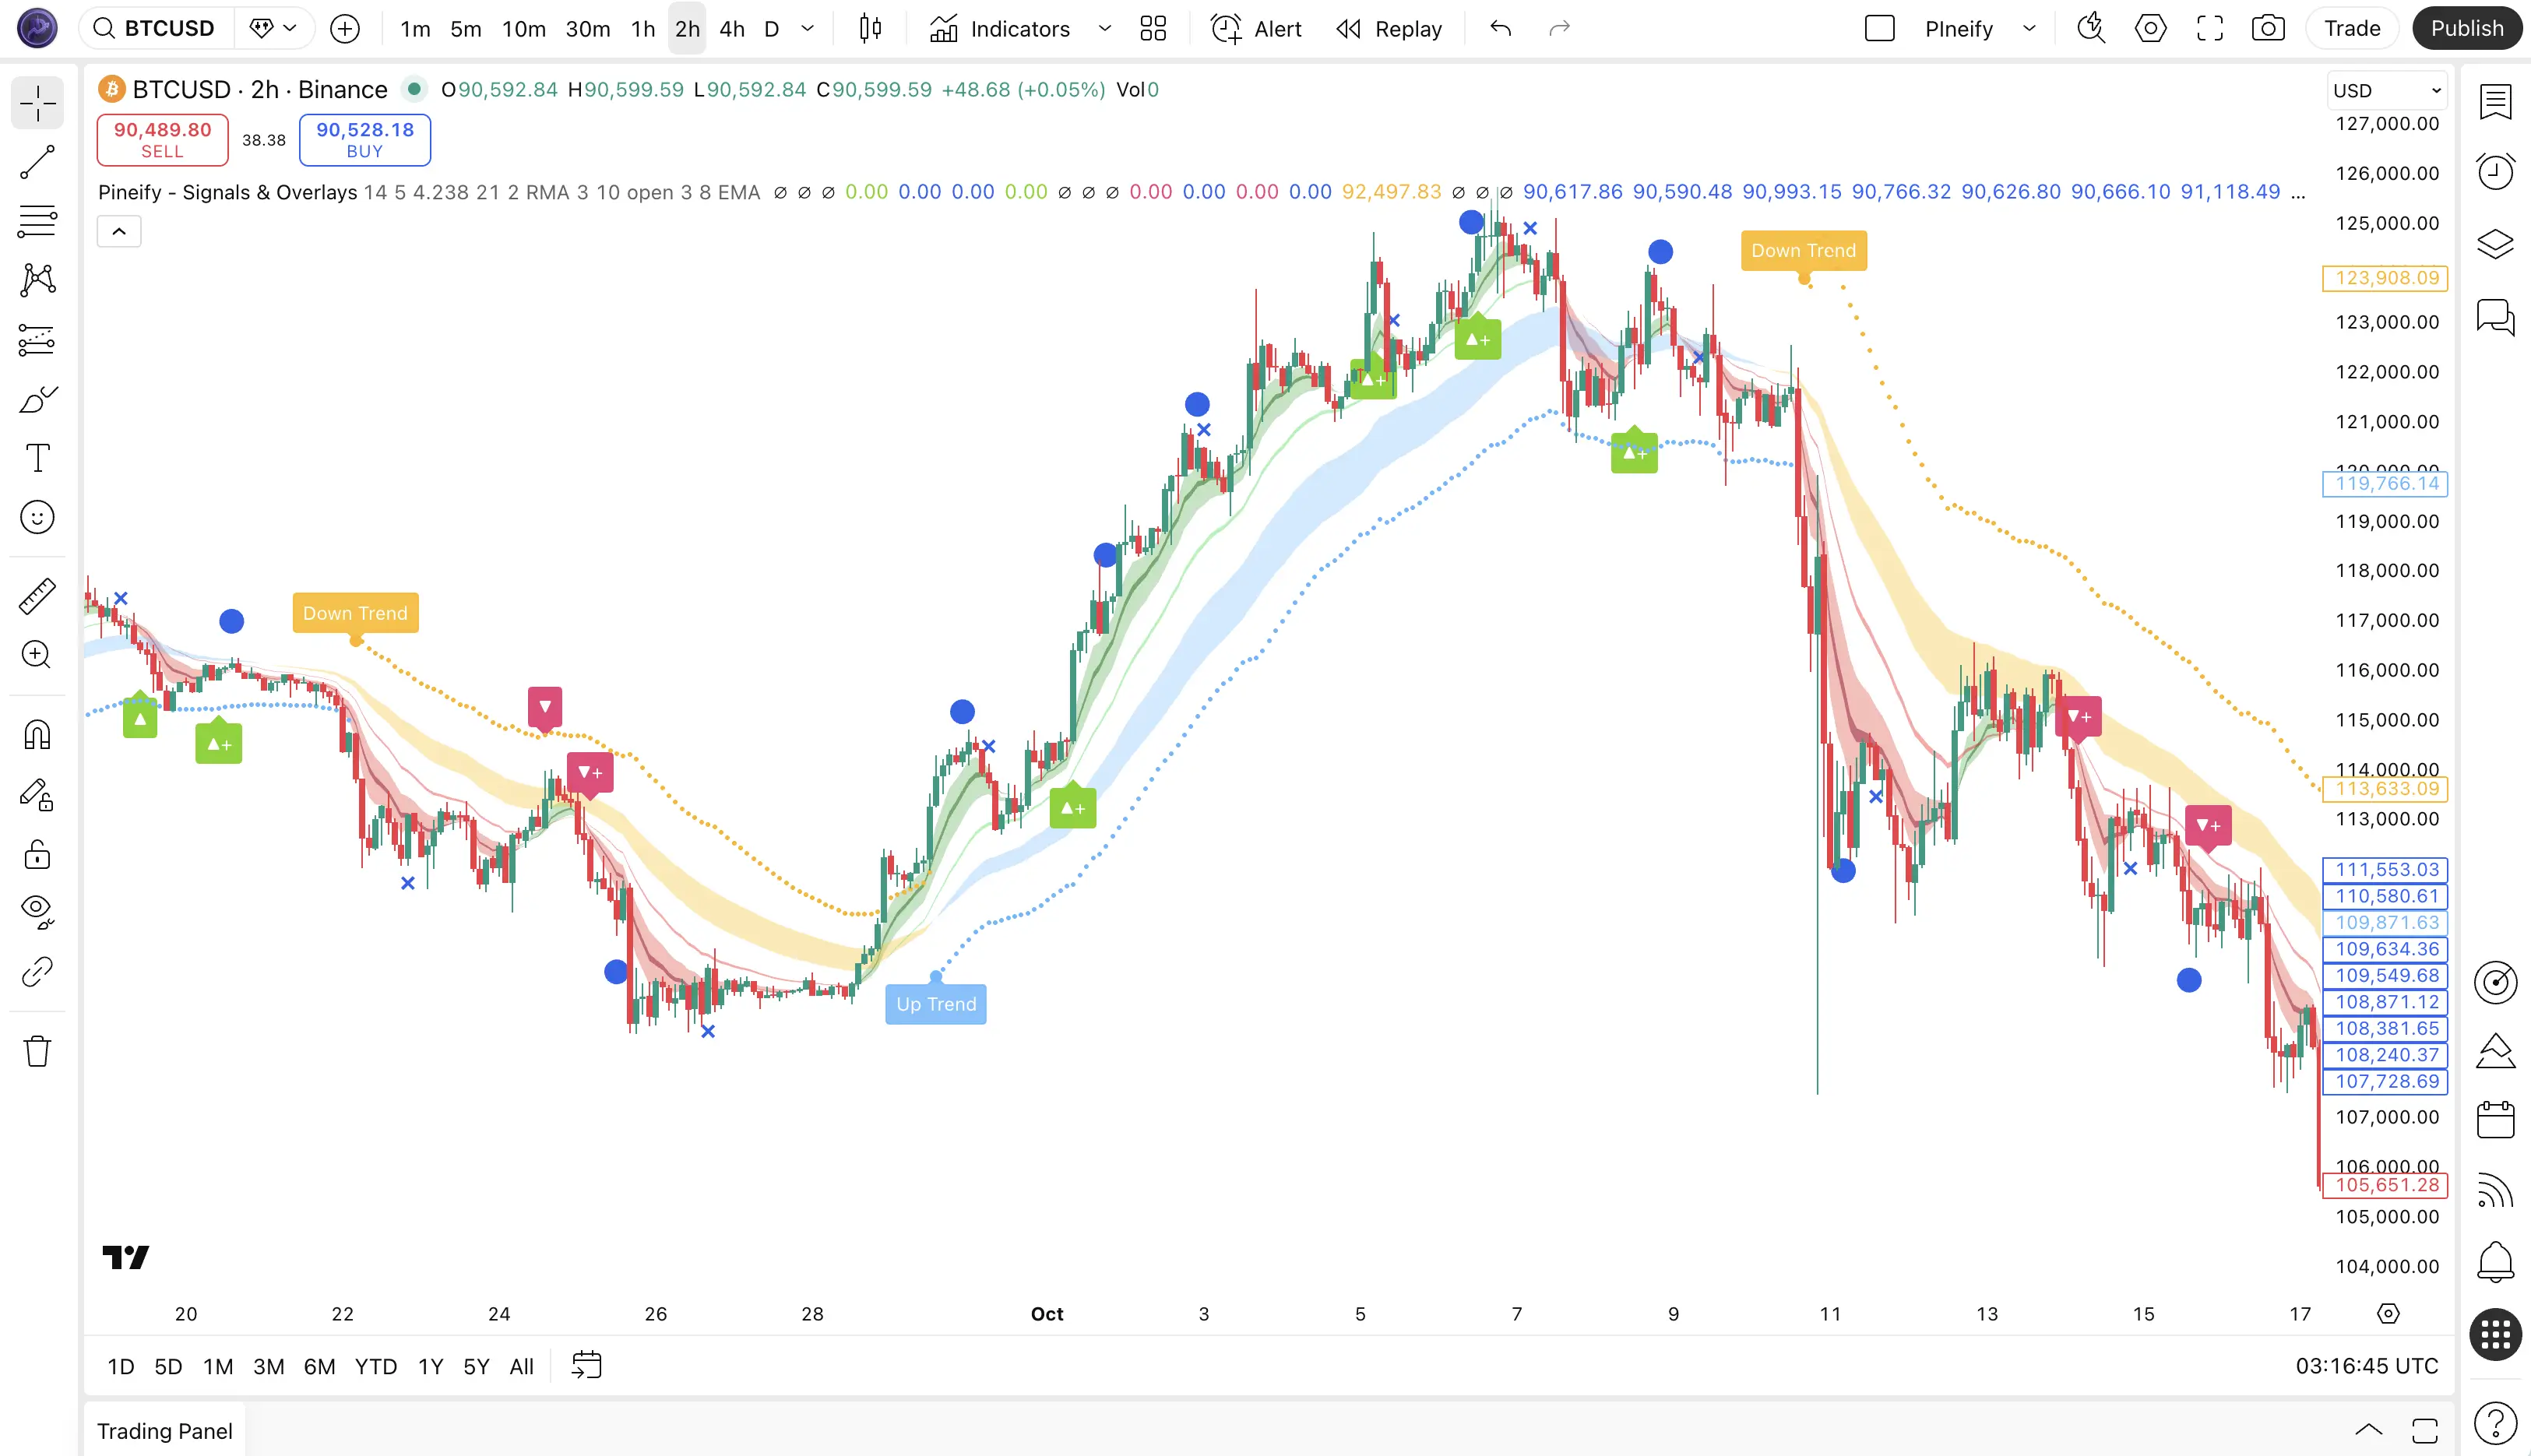
Dow Theory Trend Overlays
The colored cloud overlay is based on Dow Theory, which has been around for over a century. Blue or green means a bullish bias; red or yellow signals bearish conditions. I prefer this to reading three oscillator lines, though it works better in trending markets than in tight ranges.
ATR Stop Loss on Every Signal
An ATR stop-loss line plots automatically with each signal. The stop adjusts to current volatility rather than being a fixed number. I usually place my initial stop at that line and move it to breakeven once the trade moves in my favor.
Smarter Alerts
Alerts fire only when a confirmed high-quality signal is triggered — not for every price wiggle. On October 12, 2025, I got one alert on ETH/USD that caught a 4.2% move while ignoring seven false starts. That's the kind of filtering I need when I can't watch the charts all day.
So you're evaluating options and have probably come across AlphaTrend, SuperTrend, or WaveTrend. It's easy to feel overwhelmed.
Many traders start with free open-source tools. Eventually they want clearer signals and less noise.
We built Pineify Signals & Overlays for that exact problem. Instead of one signal type, it waits for multiple confirming factors. Here's how it stacks up head-to-head:
| Indicator | Signal Type | Multi-Timeframe Filter | Confluence-Based | ATR Stop Loss Built-In | Access Model |
|---|---|---|---|---|---|
| Godmode Oscillator | WaveTrend crossovers | No | No | No | Open-source |
| AlphaTrend | CCI + ATR trend | No | No | No | Open-source |
| SuperTrend | ATR trend direction | No | No | Partial | Open-source |
| WaveTrend Oscillator | Momentum divergence | No | No | No | Open-source |
| Pineify Signals & Overlays | Multi-factor confluence | Yes | Yes | Yes | Invite-only |
If single signals aren't cutting it and you want a tool that filters by checking multiple conditions and timeframes, this is where Pineify shines.
Who Benefits Most
Pineify Signals & Overlays works across skill levels, though it's not perfect for everyone:
- Day traders get tighter timing on 1-minute to 15-minute charts. The intraday signals are clearer than what I've seen from standalone oscillators.
- Swing traders can use 4-hour and daily signals to catch multi-day moves. The trend overlay is particularly helpful here.
- Long-term investors get a read on major market turns for portfolio timing. I wouldn't use it as a standalone decision tool — fundamental analysis still matters.
- New traders learn a consistent method without drowning in indicators. Concepts like moving averages are foundational; you can explore advanced applications in the Triple EMA Trading Strategy guide.
It works on crypto, forex, stocks, and commodities. The indicator adapts to different markets without extra configuration.
Setup in 4 Steps
Once you have access through a qualifying Pineify subscription:
- Add to chart. Open TradingView's Indicators menu, find "Invite-only scripts," select Pineify Signals & Overlays.
- Check the trend cloud. Blue or green suggests bullish; red or yellow points bearish. This gives you the big-picture context before looking at entries.
- Wait for the signal. A triangle pointing up means Long, pointing down means Short. Wait for the candle to close before treating the signal as confirmed — this avoids false triggers from intra-candle wicks.
- Manage risk. Place the stop at the plotted ATR line. Trail to breakeven when the trade moves in your favor.
The cloud shows the trend, the signals suggest timing, and the ATR line handles risk. Three pieces, one view.
Pricing
Access starts with the Advanced plan: a one-time payment of $149 (normally $219) for lifetime access. It includes the Signals & Overlays indicator, 1,000 monthly AI credits, priority access to new features, and custom indicator requests.
The Expert plan at $259 (also one-time, lifetime) adds 2,500 monthly AI credits and the AI Stocks & Options Picker.
Both are single payments — no monthly subscriptions. Compared to services charging $30-50 per month, the lifetime model saves money after about five months. The one catch: you only get updates while your account is active, so that's worth keeping in mind.
Q&A: Common Questions About Switching from Godmode to Pineify
Q: Can Pineify Signals & Overlays replace the Godmode Oscillator entirely? For most traders, yes. Pineify combines trend direction, multi-timeframe alignment, and ATR stops that Godmode doesn't offer on its own. You get a more complete picture in one tool. I'd say try it alongside Godmode for two weeks and compare.
Q: Is this indicator suitable for volatile markets like crypto? Yes. Crypto moves fast and generates lots of false alarms. Pineify's multi-factor requirement filters out noise that single-layer tools miss. During the November 2025 BTC volatility, I had zero false signals from Pineify while Godmode fired three in one afternoon.
Q: What makes invite-only indicators better than open-source ones? User pool size. Open-source tools are available to everyone. When too many traders act on the same signal, its edge fades. Invite-only access limits that pool, keeping signals more effective. Godmode's open-source nature means any of its 50,000+ users can see the exact same crossover at the same time.
Q: Do I still need risk management with such a high win rate? Absolutely. No tool is perfect, and I've had trades go against me even with all factors aligned. Position sizing, stop-losses, and daily loss limits protect you when the signal is wrong. Risk management matters more than any indicator.
Q: Can I use Pineify alongside other indicators? You can, but you may not need as many. Pineify handles trend, momentum, and volatility in one package. I still use a separate volume tool for extra confirmation on low-cap pairs, but for most setups, Pineify covers what I need.
If you're tired of hunting through a cluttered chart and guessing where your stop goes, the upgrade path is straightforward:
- Check the plans on pineify.app and grab lifetime access.
- Paper trade for at least two weeks in your usual markets.
- Log each signal's result to find which setups work best for you.
- Join the Pineify Discord community to share settings and learn from other traders.
- Work through the tutorial library on setup and backtesting.
Switching from scattered free indicators to one integrated system is what helped me find consistency. It's about understanding one reliable tool instead of endlessly searching for the next free script. You can read more about the indicator here. And if you're curious about the technical side, here's a look at Pine Script creators and how these tools are built.