Pineify Trading Journal: Multi-Strategy Analytics for Active Traders
Pineify Trading Journal is a multi-strategy trading journal that separates each approach into its own workspace with dedicated metrics, psychological logs, and auto-generated reports. Multi-strategy traders use it to isolate performance by account, strategy, or session and see which method actually performs.
If you're juggling different trading approaches — maybe a crypto breakout system, a stock momentum strategy, and a forex mean-reversion play — you already know the frustration. Pulling together performance across random spreadsheets or notebooks is confusing and eats time you'd rather spend trading.
I've been running the Pineify Trading Journal since early February 2026. I have three separate journals: one for BTC scalps, one for NVDA/AMD swing trades, and one for EUR/USD mean reversion. Each stays fully isolated with its own equity curve and metrics. It took maybe ten minutes to set up the first one, and the second two took less than five each.
If you're using specific entry techniques like those in the best scalping strategy TradingView guide, you can track that system in its own journal and compare it against your longer plays without mixing the data.
Here's what it does differently from a spreadsheet:
- Dedicated journals for each strategy or account you run.
- Side-by-side performance to spot which approach is actually profitable.
- Psychological notes tied to each trade, not just numbers.
- Auto-generated reports so you don't build them by hand.
If manual tracking has been a drag, you can check out Pineify here.
Why Multi-Strategy Traders Outgrow Their Spreadsheets
Run more than one strategy and you'll hit the wall fast. A standard journal — or worse, a homemade spreadsheet — dumps every trade into a single bucket. Was that win from your breakout system or your mean-reversion setup? Which approach is quietly losing you money? It's a guessing game.
Spreadsheets add extra pain. You're tweaking formulas constantly, they can't capture why you exited a trade early, and they break the moment you try to log partial exits. That's why traders using automated logic platforms — like those discussed in our Backtrader vs Zipline vs Pineify comparison — eventually look for a proper journaling solution too.
The fix isn't complicated. Traders who move to a structured, strategy-focused journal usually see real improvement within a few months, not because of some secret sauce but because they stop guessing and start acting on recorded data. That's why we built Pineify's journal the way we did: to handle the complexity of multiple strategies from day one. This video walkthrough shows the setup process.
Separating Strategies: Pineify's Multi-Journal Setup
Trade more than one strategy and you know how blurry the picture gets. Your fast scalping numbers get mixed with long-term swing results, and suddenly you can't tell what's actually producing. Pineify handles this with what we call the Multi-Journal Architecture.
Each journal is fully independent — like having a separate notebook per approach. You create a journal per broker account, per capital pool, or per distinct strategy:
| Feature | What It Means For You |
|---|---|
| Complete data isolation | Settings, trades, and charts stay fully separate between journals. |
| Independent equity curves | Each journal tracks its own starting capital, deposits, and withdrawals. |
| Per-journal performance metrics | Win Rate, Profit Factor, Max Drawdown — each calculated individually per journal. |
I prefer this setup over trying to cram everything into one view. If I'm scalping on Binance with one risk profile and running swings on IBKR with another, I want to see each system's true performance without cross-contamination. It's simple, and it makes capital allocation decisions much clearer.
Turn Your Journal Into a Playbook With the Strategies Module
A trading journal doesn't have to be just a logbook. Pineify's Strategies module turns it into your personal playbook. You define each setup with clear rules, then the data tells you what's working.
For each strategy — say a "VWAP pullback" or an "earnings breakout" — you set up:
- A pre-trade checklist so every entry follows rules, not impulses.
- Your entry and exit logic for consistency.
- A color-coded tag that auto-attaches to trades under that strategy.
| What You Set Up | What You Learn |
|---|---|
| A pre-trade checklist | Prevents entry on setups that don't meet your criteria. |
| Per-strategy tracking | Shows win rate and profit factor for each individual setup. |
| Color-coded trade tags | Lets you visually filter and spot patterns in seconds. |
The real value is in the numbers. I was surprised to find that one of my "reliable" breakout setups had a profit factor of 0.8 — it was quietly losing money. Meanwhile, a simple moving average bounce system I almost abandoned was running at 2.3. That kind of truth from your own data changes how you trade tomorrow.
You can codify rules from complex indicators — like those covered in the guide to Unlocking Trading Excellence with LonesomeTheBlue — into a repeatable strategy here.
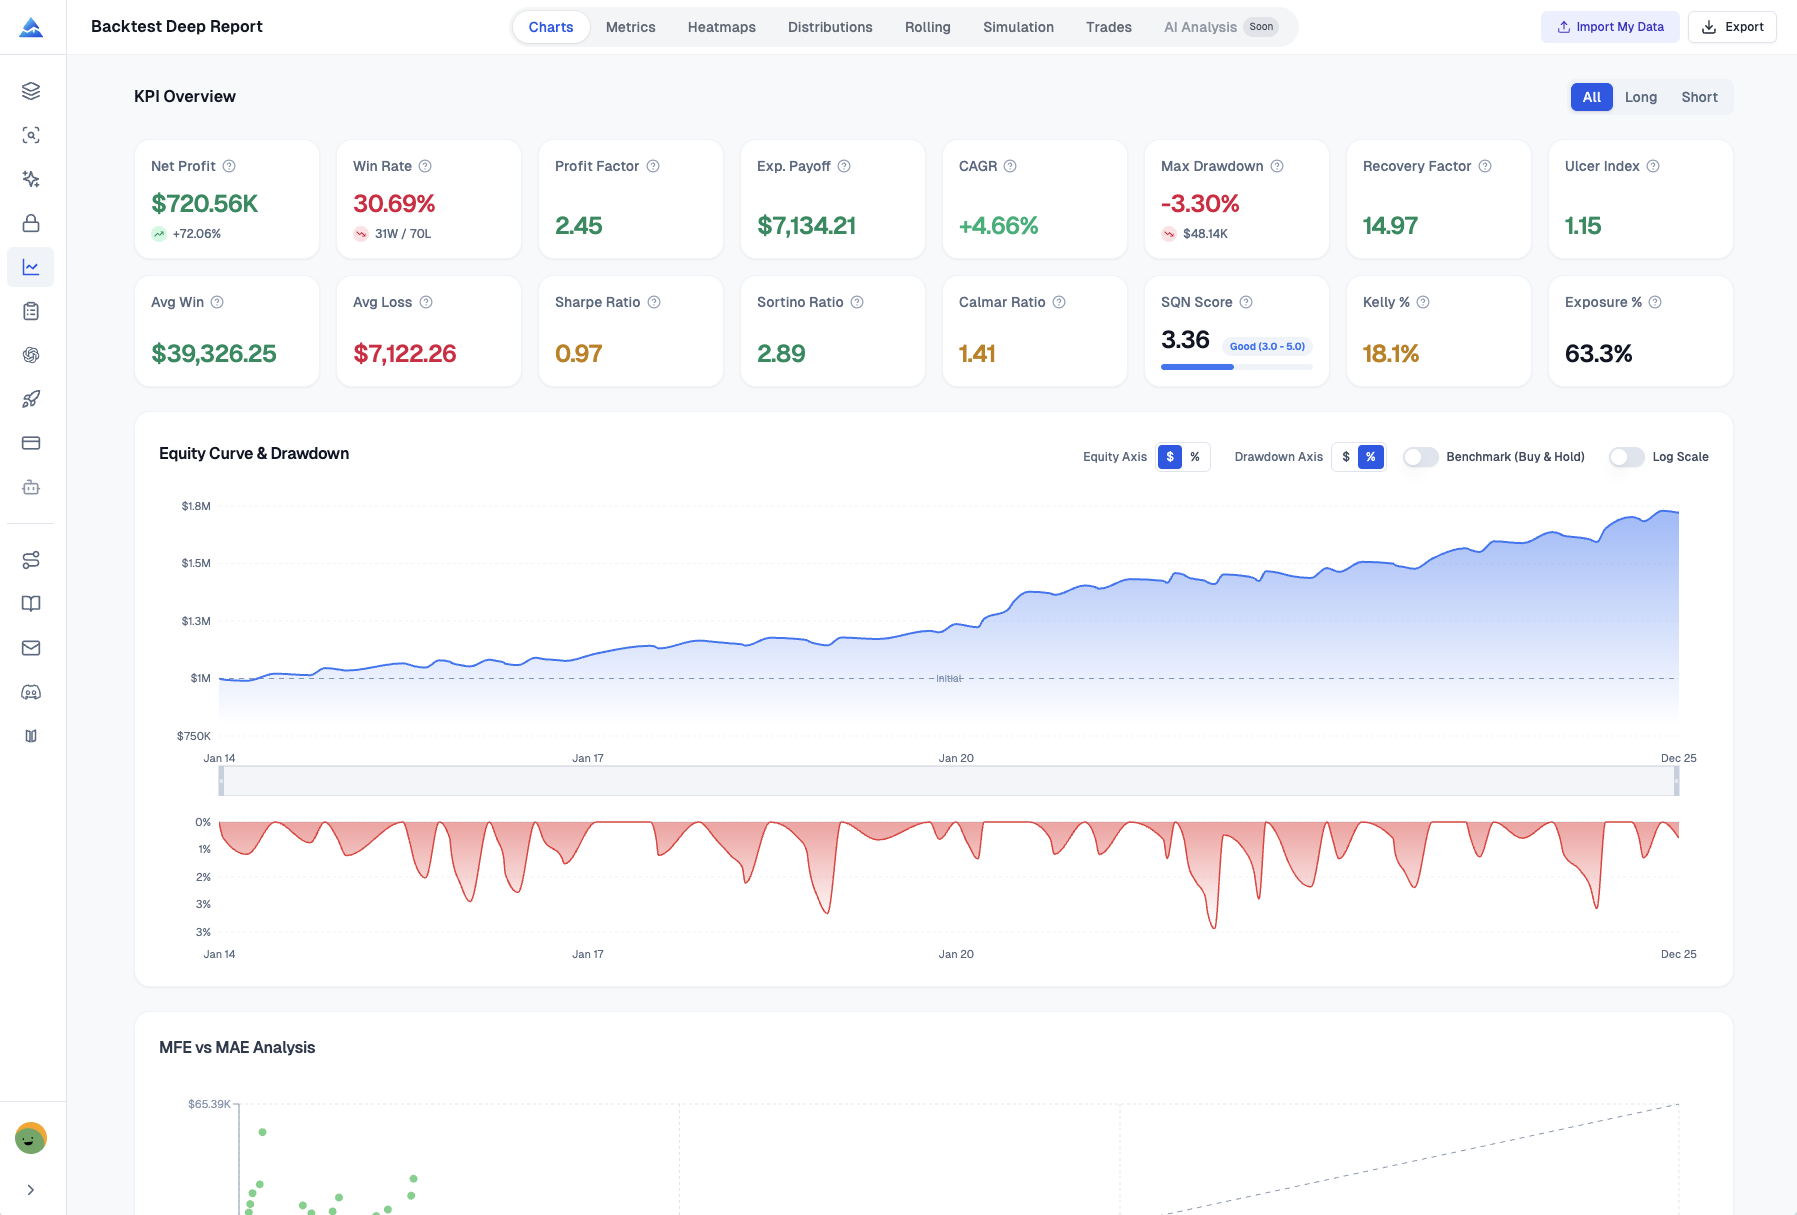
What Your Numbers Actually Say
You see wins and losses, but the why behind your performance stays hidden. The analytics in Pineify Trading Journal surface that. It takes your raw trade history and turns it into honest feedback.
No spreadsheets, no formulas — you log trades, the platform builds a dashboard. It's the kind of analysis that used to require expensive institutional software.
| Metric | What It Tells You |
|---|---|
| Net PnL & Win Rate | Overall profitability and consistency |
| Profit Factor | Gross wins / gross losses — shows system efficiency |
| Sharpe Ratio | Risk-adjusted return relative to volatility |
| Sortino Ratio | Downside-specific risk adjustment |
| Max Drawdown | Worst peak-to-trough decline |
| Daily PnL Chart | Day-by-day performance bar chart |
| Tag Performance | Which setups and symbols generate the best returns |
Partial exits, handled correctly. If you scale out of trades in chunks, you know how messy the record-keeping gets. This handles it: record each partial close, the journal auto-calculates remaining position and exact realized P&L with weighted averages. Your stats stay accurate. It's a small thing, but it matters when you're tracking systems that rely on precise entries and exits like the Weis Wave Volume Indicator.
Trading Diary: Catching the Mental Patterns
That feeling when your strategy works on paper but something feels off in the moment? The hesitation, the rush — it's not your plan, it's the headspace you're in when executing.
Most journals log numbers. Pineify's Diary covers the other part: you. Each day you can log:
- Your mood and confidence — calm, rushed, distracted?
- How you followed your rules — did you stick to the plan?
- What you learned — what worked, what didn't, the "aha" moments.
- Chart screenshots — ties your thoughts directly to market conditions.
After a few weeks of this, patterns emerge. I noticed I take worse entries when I trade during lunch hours — my win rate drops to around 35% between 12:00 and 13:30 EST. Before the diary, I had no idea. Now I just step away during that window.
I haven't tested the diary feature on mobile yet, so I can't speak to how it works on a phone screen. On desktop it takes about two minutes per day.
This video walks through the diary setup.
Find Your Trading Rhythm With the Sessions Module
Your results aren't the same across all hours. Some windows feel chaotic, others click. The Sessions module helps you spot those patterns by defining your own trading shifts — London open, New York session, or any custom window.
Instead of looking at performance as one blur, this tool sorts trades into the time windows you define, then aggregates P&L and trade counts per session.
- Set your own hours that match your schedule and markets.
- See session-by-session P&L and trade frequency.
- Rate your mood each session to connect mindset with outcomes.
The signal is real. I found my win rate runs 65% during the London-New York overlap but drops to 38% in the Asian session. That's not noise — it's a clear instruction to stop trading Asia.
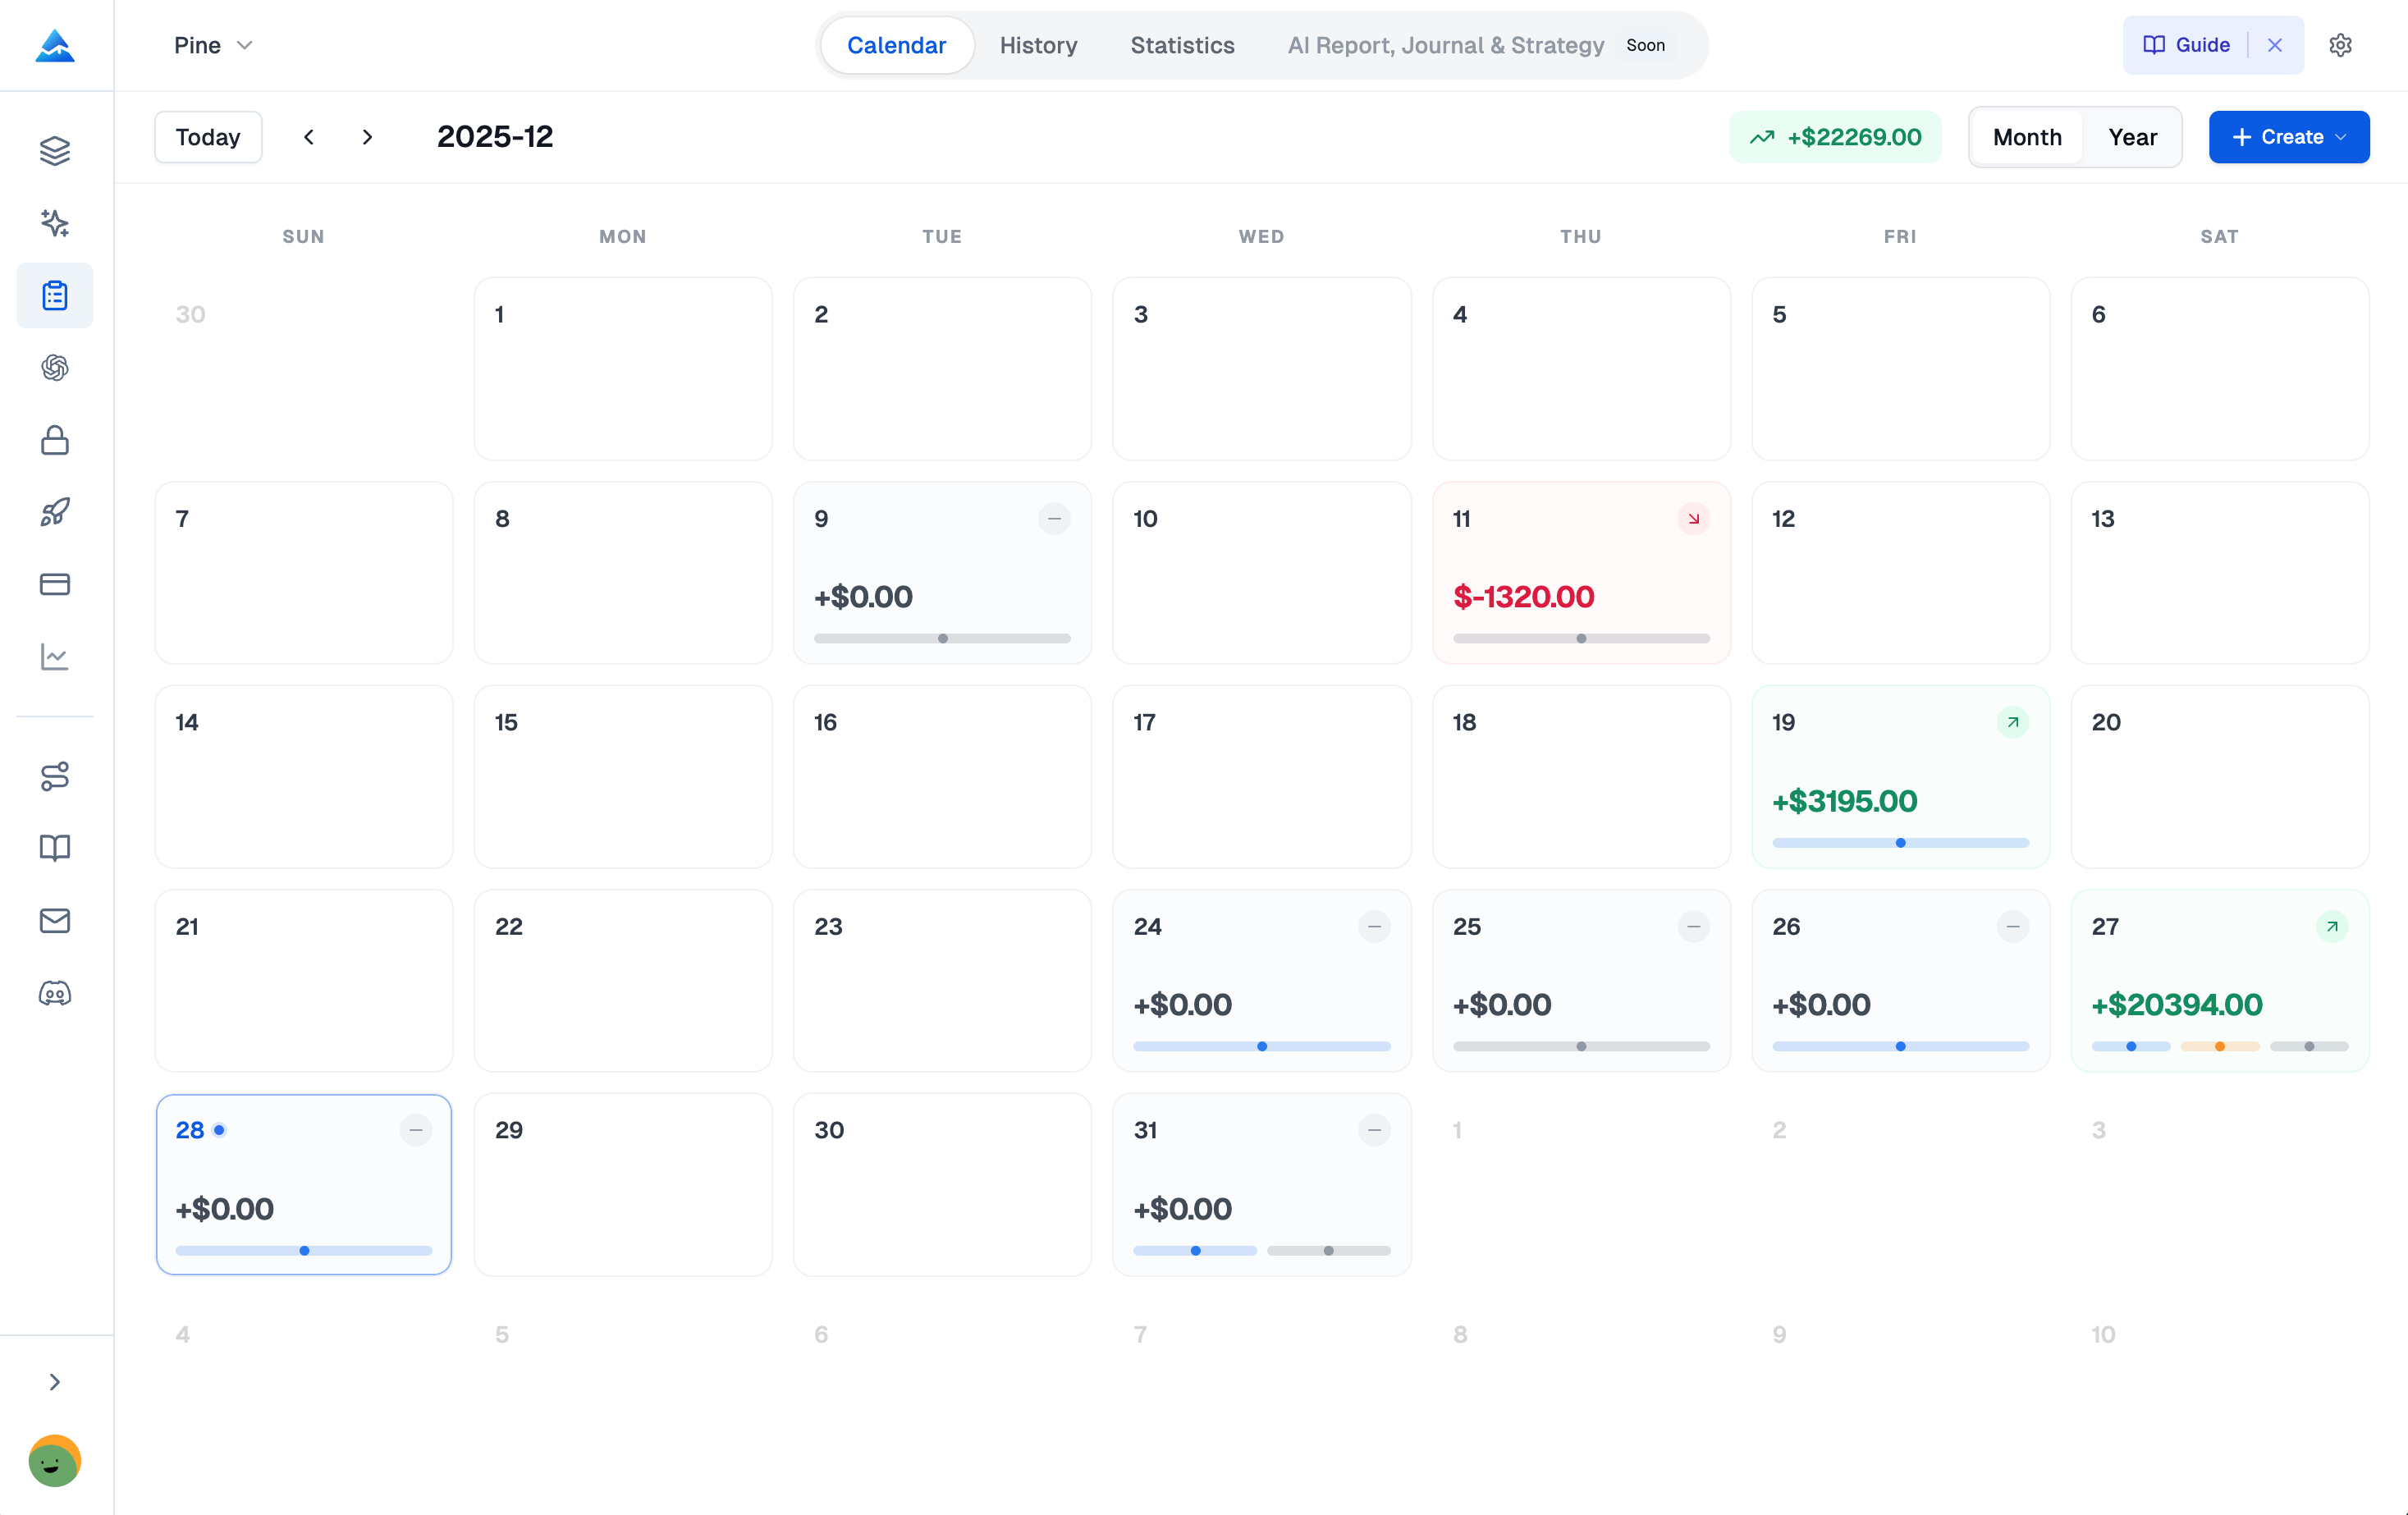
Weekly and Monthly Reports, Generated Automatically
Compiling trading reviews is a chore, but that's where the insights live. The Reports module takes the work out of it. Instead of building spreadsheets, Pineify auto-creates structured weekly and monthly reports across every key area.
Each auto-generated report includes:
- Breakdown by symbol, side, and strategy — who's winning and who's losing.
- Best and worst trade highlights — identify extreme outcomes.
- Profit Factor over time — is your edge holding steady or fading?
- Behavior patterns — overtrading after losses, hesitation before wins, and more.
Most journals leave you to pull this analysis yourself. Automating it means the review actually happens, consistently. I've been getting mine every Sunday evening since I started, and I can see measurable improvement month over month.
How Pineify Trading Journal Compares
There are a lot of journaling options. Here's how Pineify stacks up against typical alternatives:
| Feature | Pineify Trading Journal | Generic Spreadsheet | TradeZella |
|---|---|---|---|
| Multi-journal support | Full data isolation | Manual tabs | Available |
| Per-strategy analytics | Win Rate, PF per setup | Manual formulas | Available |
| Psychological diary | Mood, adherence, lessons | Not included | Limited |
| Sessions module | Custom time windows | Not included | Not included |
| Auto-generated reports | Weekly & monthly | Manual | Available |
| Partial close support | Weighted avg calc | Complex manual work | Available |
| Pricing model | One-time lifetime access | Free | Monthly subscription |
A generic spreadsheet gets the job done if you enjoy building formulas. I don't. I've used spreadsheets for years and they always devolve into a maintenance headache.
TradeZella is a solid app, and plenty of traders I respect use it. But the monthly fee adds up — $30/month becomes $360/year after year. Pineify's one-time model costs less over 12 months and gives you lifetime access. That said, I haven't compared their tag system or mobile app directly, so I can't say Pineify wins every category.
If you're also comparing charting platforms, here's our TradingView vs Finviz comparison.
Beyond the journal, Pineify includes a Visual Editor for TradingView indicators, an AI Coding Agent for strategy coding, an AI Stock Picker, and a Finance Agent for market research. All of it, lifetime access, one payment.
The journal is one piece of a larger toolkit built for active traders. For more details, there's a full post on Pineify's blog.
Q&A: Common Questions About the Pineify Trading Journal
Q: Is the Trading Journal free to use? It's included in the Advanced Plan and above, not in the base Plus tier. You get it alongside the Backtest Deep Report and market Signals & Overlays.
Q: Can I track multiple brokerage accounts? Yes. I run separate journals for Binance and Alpaca myself. Each has its own equity curve, performance metrics, and settings — nothing leaks between them.
Q: Does Pineify support partial exits and scaling out of trades? It does. You log multiple exits per trade, and the journal handles the weighted average math automatically — remaining position size, realized P&L, everything.
Q: How is my data protected? It's stored in Pineify's encrypted cloud with standard encryption. Only you can access your records.
Q: Can I use the Strategies module to track pre-trade checklists? Yes, you set up a checklist when creating a strategy. Then every trade logged under that strategy contributes to its long-term performance stats — Win Rate, Profit Factor, the works.
Turn Your Data Into an Edge
The traders who improve consistently aren't the ones with the best strategy. They're the ones with an honest review system. A dedicated journal closes that gap.
The Pineify Trading Journal gives you separate journals per account, per-strategy analytics, a psychological diary, session-based performance breakdowns, and automated reports. It adapts whether you're a beginner exploring AI stock trading or someone running multiple complex systems.
Getting started:
- Visit the feature page: pineify.app/trading-journal for the full rundown.
- Sign up for the Advanced Plan and get the journal plus the other modules.
- Create your first journal for one strategy. Keep it simple. Add more later.
- Log trades for a few weeks and check your first auto-generated report.
- Use the Diary daily — even two sentences is enough to reveal patterns over time.
The best time to start journaling was your first trade. The second-best time is now. Try the Pineify Trading Journal and see what your own data tells you.
Here's the short overview video showing it in action.