ChartDetector Alternative: Pineify AI Stock Chart Analysis

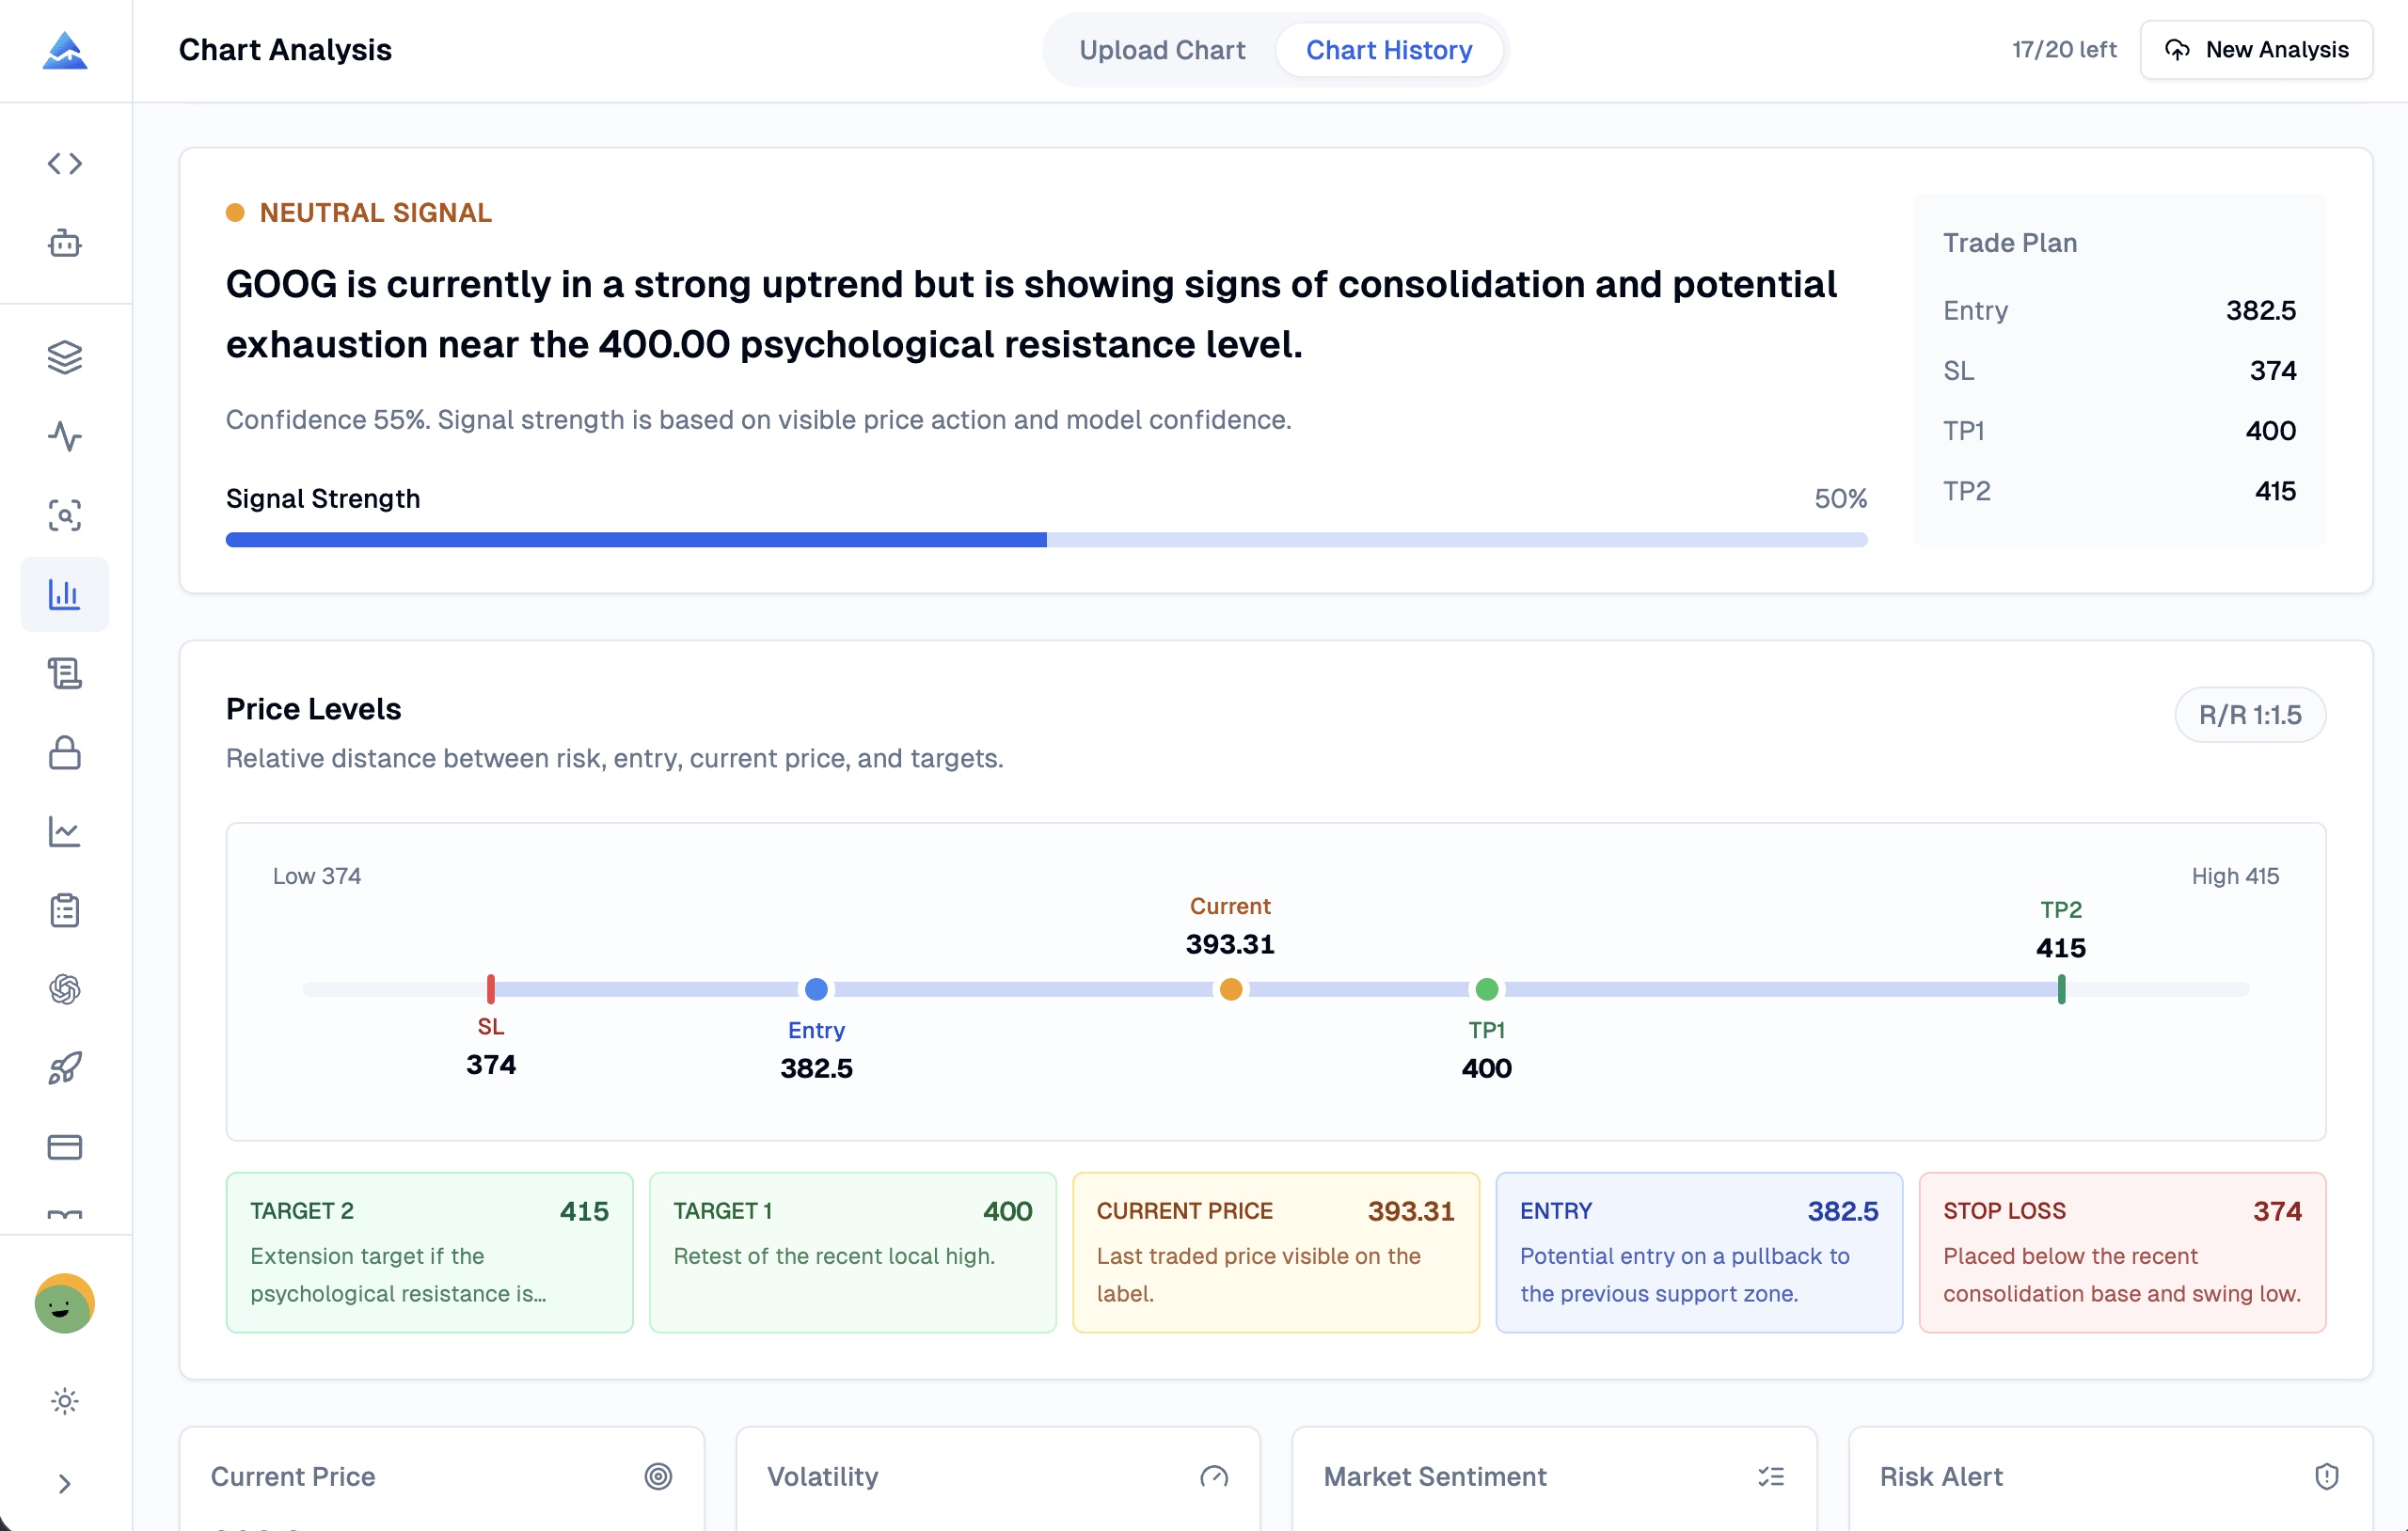
A search for a ChartDetector alternative usually starts with one task: upload a stock chart and get a useful technical read without drawing every level by hand. Pineify handles that task with a focused screenshot workflow. It reads visible price action and returns a signal, confidence score, support, resistance, entry, stop loss, two targets, risk notes, and a saved analysis record.
ChartDetector and Pineify overlap, but they are not identical products. ChartDetector is a broad trading decision-intelligence platform with market scans, multi-timeframe analysis, portfolio tools, correlation analysis, and backtesting. Pineify AI Stock Chart Analysis is a better fit when you want a repeatable review of one chart screenshot and an output format that is easy to audit.
ChartDetector alternative: quick answer
Pineify is a strong ChartDetector alternative for screenshot-based stock and crypto chart review. Upload one clean chart image and Pineify organizes the visible setup into fixed fields instead of returning a loose paragraph.
The choice depends on the job:
| Your main need | Better fit | Reason |
|---|---|---|
| Review one chart screenshot quickly | Pineify | The result separates signal, confidence, price levels, technical context, risks, and uncertainties |
| Scan many markets for new ideas | ChartDetector | Its public product pages include market scanners and opportunity discovery |
| Compare several timeframes inside one analysis | ChartDetector | Multi-timeframe analysis is part of its stated workflow |
| Track whether a reviewed setup won, lost, or was not taken | Pineify | Analysis history includes outcome labels and performance statistics |
| Combine chart review with Pine Script tools and a trading journal | Pineify | The chart analyzer sits inside the wider Pineify trading toolkit |
| Work with portfolio allocation and correlation | ChartDetector | Its platform includes portfolio intelligence and correlation analysis |
The useful distinction is focus. ChartDetector covers more research surfaces. Pineify goes deeper on the structure of a single screenshot review and the follow-up record.
What ChartDetector does
ChartDetector describes itself as an AI-powered trading decision-intelligence platform for crypto, stocks, ETFs, forex, and commodities. Its main workflow accepts a chart, ticker, or contract address. The system then evaluates market structure, momentum, volatility, risk, and multi-timeframe context.
Its public product pages list several tools beyond chart upload:
- AI chart and trade analysis
- Market scanners and opportunity discovery
- Trade validation and risk confirmation
- Portfolio intelligence
- Correlation analysis
- Strategy backtesting
- Watchlists and exportable reports
That range makes ChartDetector useful when chart reading is one part of a larger research process. It also means a trader looking only for screenshot analysis may be paying attention to features that are outside the immediate task.
According to the ChartDetector pricing page, the free plan includes 5 analyses per day, Quick Glance and In-Depth modes, one daily market scan per asset type, PDF export, and access to the last 10 analyses. The Pro plan was listed at $99 per year when this article was reviewed on July 27, 2026. It adds unlimited analyses, advanced risk tools, scanners, watchlists, correlation analysis, and backtesting. Pricing can change, so verify the official page before choosing a plan.
What Pineify AI Stock Chart Analysis returns
Pineify AI Stock Chart Analysis starts with a JPEG, PNG, or WebP screenshot. The image can be up to 3 MB. You do not enter a ticker or timeframe in separate form fields. Pineify attempts to read that context from the image and uses Unknown when it cannot do so with confidence.
The result is divided into reviewable sections:
| Result section | Fields you can inspect |
|---|---|
| Direction | Buy, Sell, or Neutral signal; confidence score; signal strength; one-sentence summary |
| Price levels | Current price, support, resistance, suggested entry, stop loss, target 1, and target 2 |
| Market state | Volatility, market sentiment, risk-reward ratio, and risk alert |
| Technical analysis | Key levels, level strength, market structure, chart pattern, and candle context |
| Risk management | Entry type, position-sizing guidance, invalidation level, and risk-reward ratio |
| Review notes | Situation summary, signal rationale, suggested action, key risks, and uncertainties |
| History | Symbol, timeframe, signal, confidence, risk-reward ratio, date, and recorded outcome |
The history is more than an archive. Pineify lets you mark a setup as WON, LOST, or NOT_TAKEN. Its statistics view can then show total analyses, win rate, average risk-reward ratio, and the mix of Buy, Sell, and Neutral entries. That feedback loop is useful because it lets you judge the quality of your own screening process instead of treating each AI answer as a disposable prediction.
ChartDetector vs Pineify
This comparison uses the products' public pages and Pineify's current chart-analysis interface. It does not assign accuracy scores because neither public feature list is a controlled benchmark.
| Feature | ChartDetector | Pineify AI Stock Chart Analysis |
|---|---|---|
| Primary input | Chart, ticker, or contract address | One chart screenshot |
| Main product scope | Market analysis, scanning, trade validation, portfolio tools, and backtesting | Structured chart screenshot review with saved history |
| Markets stated publicly | Crypto, stocks, ETFs, forex, and commodities | Stocks, ETFs, crypto, and other readable candlestick screenshots |
| Multi-timeframe workflow | Yes, stated as a core analysis feature | Reads the timeframe visible in the uploaded image |
| Directional output | Trade analysis and risk validation | Buy, Sell, or Neutral with confidence and signal strength |
| Price levels | Entry, invalidation, targets, and risk metrics are part of its trade-planning tools | Current price, support, resistance, entry, stop loss, two targets, and invalidation |
| Technical context | Structure, momentum, volatility, sentiment, and multi-timeframe context | Structure, pattern, candle context, volatility, sentiment, and key levels |
| Risk output | RiskConfirm tools, alignment scores, optimization, and risk-reward analysis | Risk alert, risk-reward ratio, position-sizing guidance, uncertainties, and key risks |
| History | Last 10 analyses on Free; unlimited history on Pro | Searchable analysis history with symbol, signal, and outcome filters |
| Outcome tracking | Backtesting and performance reports are listed on Pro | Mark each reviewed setup as Won, Lost, or Not Taken |
| Free or paid access | Free plan with 5 analyses per day; Pro listed at $99 per year | Included in Pineify plans with daily limits shown on the product page |
| Best fit | Traders who want a broad market-intelligence workspace | Traders who want a focused screenshot-to-review workflow |
Neither column is universally better. ChartDetector has broader asset and portfolio coverage. Pineify exposes more of the single-chart review as named fields and connects the result to outcome tracking.
Why Pineify works as a ChartDetector alternative
The output is easy to check against the chart
A direction label by itself is hard to audit. Pineify puts the proposed support, resistance, entry, stop, targets, invalidation, and risk-reward ratio in separate fields. You can place those values back on the chart and see where the AI read is sensible or weak.
This matters when two people review the same setup. They can discuss a specific support level or invalidation point instead of interpreting a long AI response differently.
Uncertainty stays visible
Pineify includes a confidence score, risk alert, key risks, and an uncertainties list. Low confidence does not prove that a setup is wrong, and high confidence does not prove that it will work. These fields tell you where the model sees ambiguity so you know what needs manual review.
The review continues after the analysis
An AI chart answer has little value if you never check what happened next. Pineify keeps the image and structured result in history, then lets you record WON, LOST, or NOT_TAKEN. Over time, the statistics can reveal whether you accept too many low-confidence setups or favor one direction without good results.
It connects chart reading to a wider research workflow
A screenshot cannot explain an earnings surprise, a balance-sheet problem, or unusual options flow. Pineify provides separate tools for those jobs. You can use the AI stock analysis research page to plan an LLM-based research process, the AI Stock Picker to narrow a watchlist, and the Backtest Deep Report to review a rule-based strategy.
Keeping those jobs separate is useful. The chart analyzer reads visible structure. Fundamental research and backtesting answer different questions.
How to analyze a stock chart with Pineify
- Open the stock, ETF, or crypto chart in your usual charting platform.
- Choose the timeframe that matches the trade horizon. A 15-minute chart and a weekly chart answer different questions.
- Remove drawings or indicators that cover the candles. Keep the price scale and recent structure readable.
- Capture a native screenshot and save it as JPEG, PNG, or WebP under 3 MB.
- Upload the image to Pineify AI Stock Chart Analysis.
- Check whether Pineify read the symbol and timeframe correctly.
- Compare the support, resistance, entry, stop, targets, and invalidation with the full chart.
- Read the risk alert and uncertainties before considering the directional signal.
- Save the setup only if it matches your own rules. Record the result later, including
NOT_TAKENwhen you passed on the trade.
This process treats AI as a second reviewer. The model extracts visible structure quickly, while you remain responsible for context, execution, and risk.
Screenshot checklist for more useful AI chart analysis
Image quality controls how much information any chart-vision model can read. Before uploading, check the following:
- Candles are sharp enough to separate bodies from wicks.
- The price scale is visible and not cropped.
- The screenshot includes enough prior price action to show recent swing highs and lows.
- The selected timeframe is visible on the chart.
- Popups, watchlists, tooltips, and order tickets do not cover the setup.
- Indicator panels are included only when they matter to the question.
- Logarithmic or linear scale settings are visible when they affect long-range levels.
- The chart does not expose account numbers, orders, balances, or personal information.
One screenshot also means one visible context window. If the daily and weekly structures disagree, analyze each timeframe separately and compare the results yourself.

When ChartDetector may be the better fit
ChartDetector is the more natural choice when you want the AI to search for opportunities rather than review a chart you already selected. Its scanners, market-rotation tools, portfolio features, correlation analysis, and multi-timeframe workflow cover tasks outside Pineify's screenshot analyzer.
It may also fit teams that want one platform for chart analysis, risk validation, portfolio review, and backtesting. The Pro plan includes unlimited analysis history and export tools, while Pineify applies daily chart-analysis limits by plan.
Pineify is the narrower choice. That can be an advantage for a trader who already has a charting platform and wants a structured second opinion, but it is a limitation if you expect the analyzer to scan the market or rebalance a portfolio.
Limits of AI stock chart analysis
A chart screenshot contains price information, but it does not contain the full market.
- The image may omit overnight gaps, earlier support zones, or higher-timeframe structure.
- News, earnings, guidance, interest rates, and sector events are absent unless they appear on the chart.
- A detected pattern can fail even when the visual classification is correct.
- Estimated support and resistance are zones, not exact guarantees.
- Entry, stop, and target values can be wrong because the model can misread the scale or structure.
- Confidence measures model certainty about the visible setup. It is not the probability of a profitable trade.
The SEC, NASAA, and FINRA investor alert on AI-generated investment information warns that AI output may rely on inaccurate, incomplete, misleading, or fabricated information. Verify important facts through independent sources and never treat an AI chart result as financial advice or a guaranteed signal.
Frequently asked questions
What is the best ChartDetector alternative for stock chart screenshots?
Pineify is a practical alternative when the main job is turning one stock or crypto chart screenshot into a structured review. The result includes a direction, confidence score, support, resistance, entry, stop loss, targets, risk notes, and saved history.
Is Pineify AI Stock Chart Analysis free?
Pineify uses plan-based daily limits rather than advertising unlimited free analysis. Its product page currently lists 2, 5, or 20 chart analyses per day across the Plus, Advanced, and Expert plans. Check the current pricing page before subscribing because limits and prices can change.
Can Pineify analyze a TradingView chart screenshot?
Yes. Pineify accepts JPEG, PNG, and WebP chart images up to 3 MB. A clean screenshot with readable candles, a visible price scale, and limited visual clutter gives the model more usable information than a cropped or blurry image.
Does Pineify detect chart patterns and support and resistance?
Yes. The structured result includes market structure, chart pattern, candle context, key support and resistance levels, level strength, and uncertainty notes. Verify every detected level on the full chart before using it in a trade plan.
Is ChartDetector or Pineify better?
ChartDetector fits traders who want a broader decision-intelligence platform with scanners, multi-timeframe analysis, portfolio tools, correlation analysis, and backtesting. Pineify fits traders who want a focused screenshot workflow with explicit price levels, risk fields, analysis history, and outcome tracking.
Can AI stock chart analysis predict the next price move?
No AI chart analyzer can reliably predict the next price move from an image alone. A screenshot omits news, fundamentals, liquidity outside the visible range, and future order flow. Use the result as a research aid and confirm it with independent analysis and risk controls.