Pineify Signals & Overlays: A Premium Confluence TradingView Indicator
You load six indicators onto your TradingView chart. Each one flashes a different verdict — buy here, sell there, the third just flatlines. That noise kills clarity, and often it kills the trade itself.
Pineify Signals & Overlays is an invite-only TradingView indicator that cuts through that mess. It checks every price bar through three filters at once — trend direction, momentum strength, and current volatility — and only fires a signal when all three agree. I've been running it on TSLA since the February 2026 earnings week, and the long signals caught the post-earnings gap cleanly.
The system comes from the Pineify team, which supports over 100,000 active traders. It's not publicly listed, so signal crowding isn't the problem it becomes with popular public indicators. The backtest data shows an 87% win rate and a 412% max return per trade across multiple markets and timeframes. Those numbers are solid, but I wouldn't buy into any tool on backtest data alone — real trading is messier.
The Core Problem It Solves: Too Many Indicators
You start simple with a moving average line. Then you add MACD for momentum. Then RSI for overbought levels. Then Bollinger Bands for volatility. Before long your chart is a rainbow of conflicting lines, and you're stuck watching one indicator say "buy" while another screams "sell."
I've been there more times than I'd like to admit. That's analysis paralysis, and it leads to missed entries or bad ones. Instead of making you juggle five tools, Pineify handles the synthesis. It waits for independent factors — trend, momentum, volatility — to line up before it paints a signal on the chart. Think of it as getting a second opinion that's already done the cross-checking. If you're looking for a tighter approach to timing entries, the best indicator for entry and exit tradingview page covers complementary methods.
Breaking Down the Key Features
This indicator is built around practical needs. Here is a straightforward look at what it does and why each piece matters.
| Feature | What It Does | Benefit |
|---|---|---|
| Multi-Factor Confluence Engine | Evaluates trend, momentum, and volatility simultaneously. | Surfaces only the strongest, highest-probability setups. |
| Multi-Timeframe Filter | Checks the larger trend before confirming a signal. | Keeps you trading with the main move. |
| Visual Signal System | Plots colored arrows, highlighted candles, and ATR-based lines. | Clear visual cues for entry and exit points. |
| Real-Time Alerts | Sends push notifications through TradingView to your devices. | You can step away without FOMO. |
| Dow Theory Foundation | Rooted in classical primary and secondary trend analysis. | Signals trace back to time-tested market principles. |
| ATR Stop Line | Dynamic stop-loss level based on Average True Range. | Takes the guesswork out of risk placement. |
How the Scoring System Works
Think of the scoring as a live report card for each new candle. It grades three subjects — trend conviction, momentum power, and volatility conditions — then rolls them into a single number.
When that score crosses your chosen threshold, the indicator lights up with a colored arrow (long or short) or a highlighted candle for especially strong alignment. The three factors are independent of each other, so a false signal is much harder to generate when unrelated measurements all have to agree. This is the math behind what experienced traders call confluence — that moment when the pieces click at the same price.
Understanding how this kind of state tracking works under the hood is explored in detail in our guide on understanding global variables in Pine Script, which covers the logic behind multi-factor calculations.
How to Use It: A Simple 4-Step Guide
Once you have access, here is the workflow I follow on my own charts.
-
Add it to your chart. Head to the Indicators menu on TradingView, click Invite-only scripts, and select Pineify Signals & Overlays. It loads right onto your price panel.
-
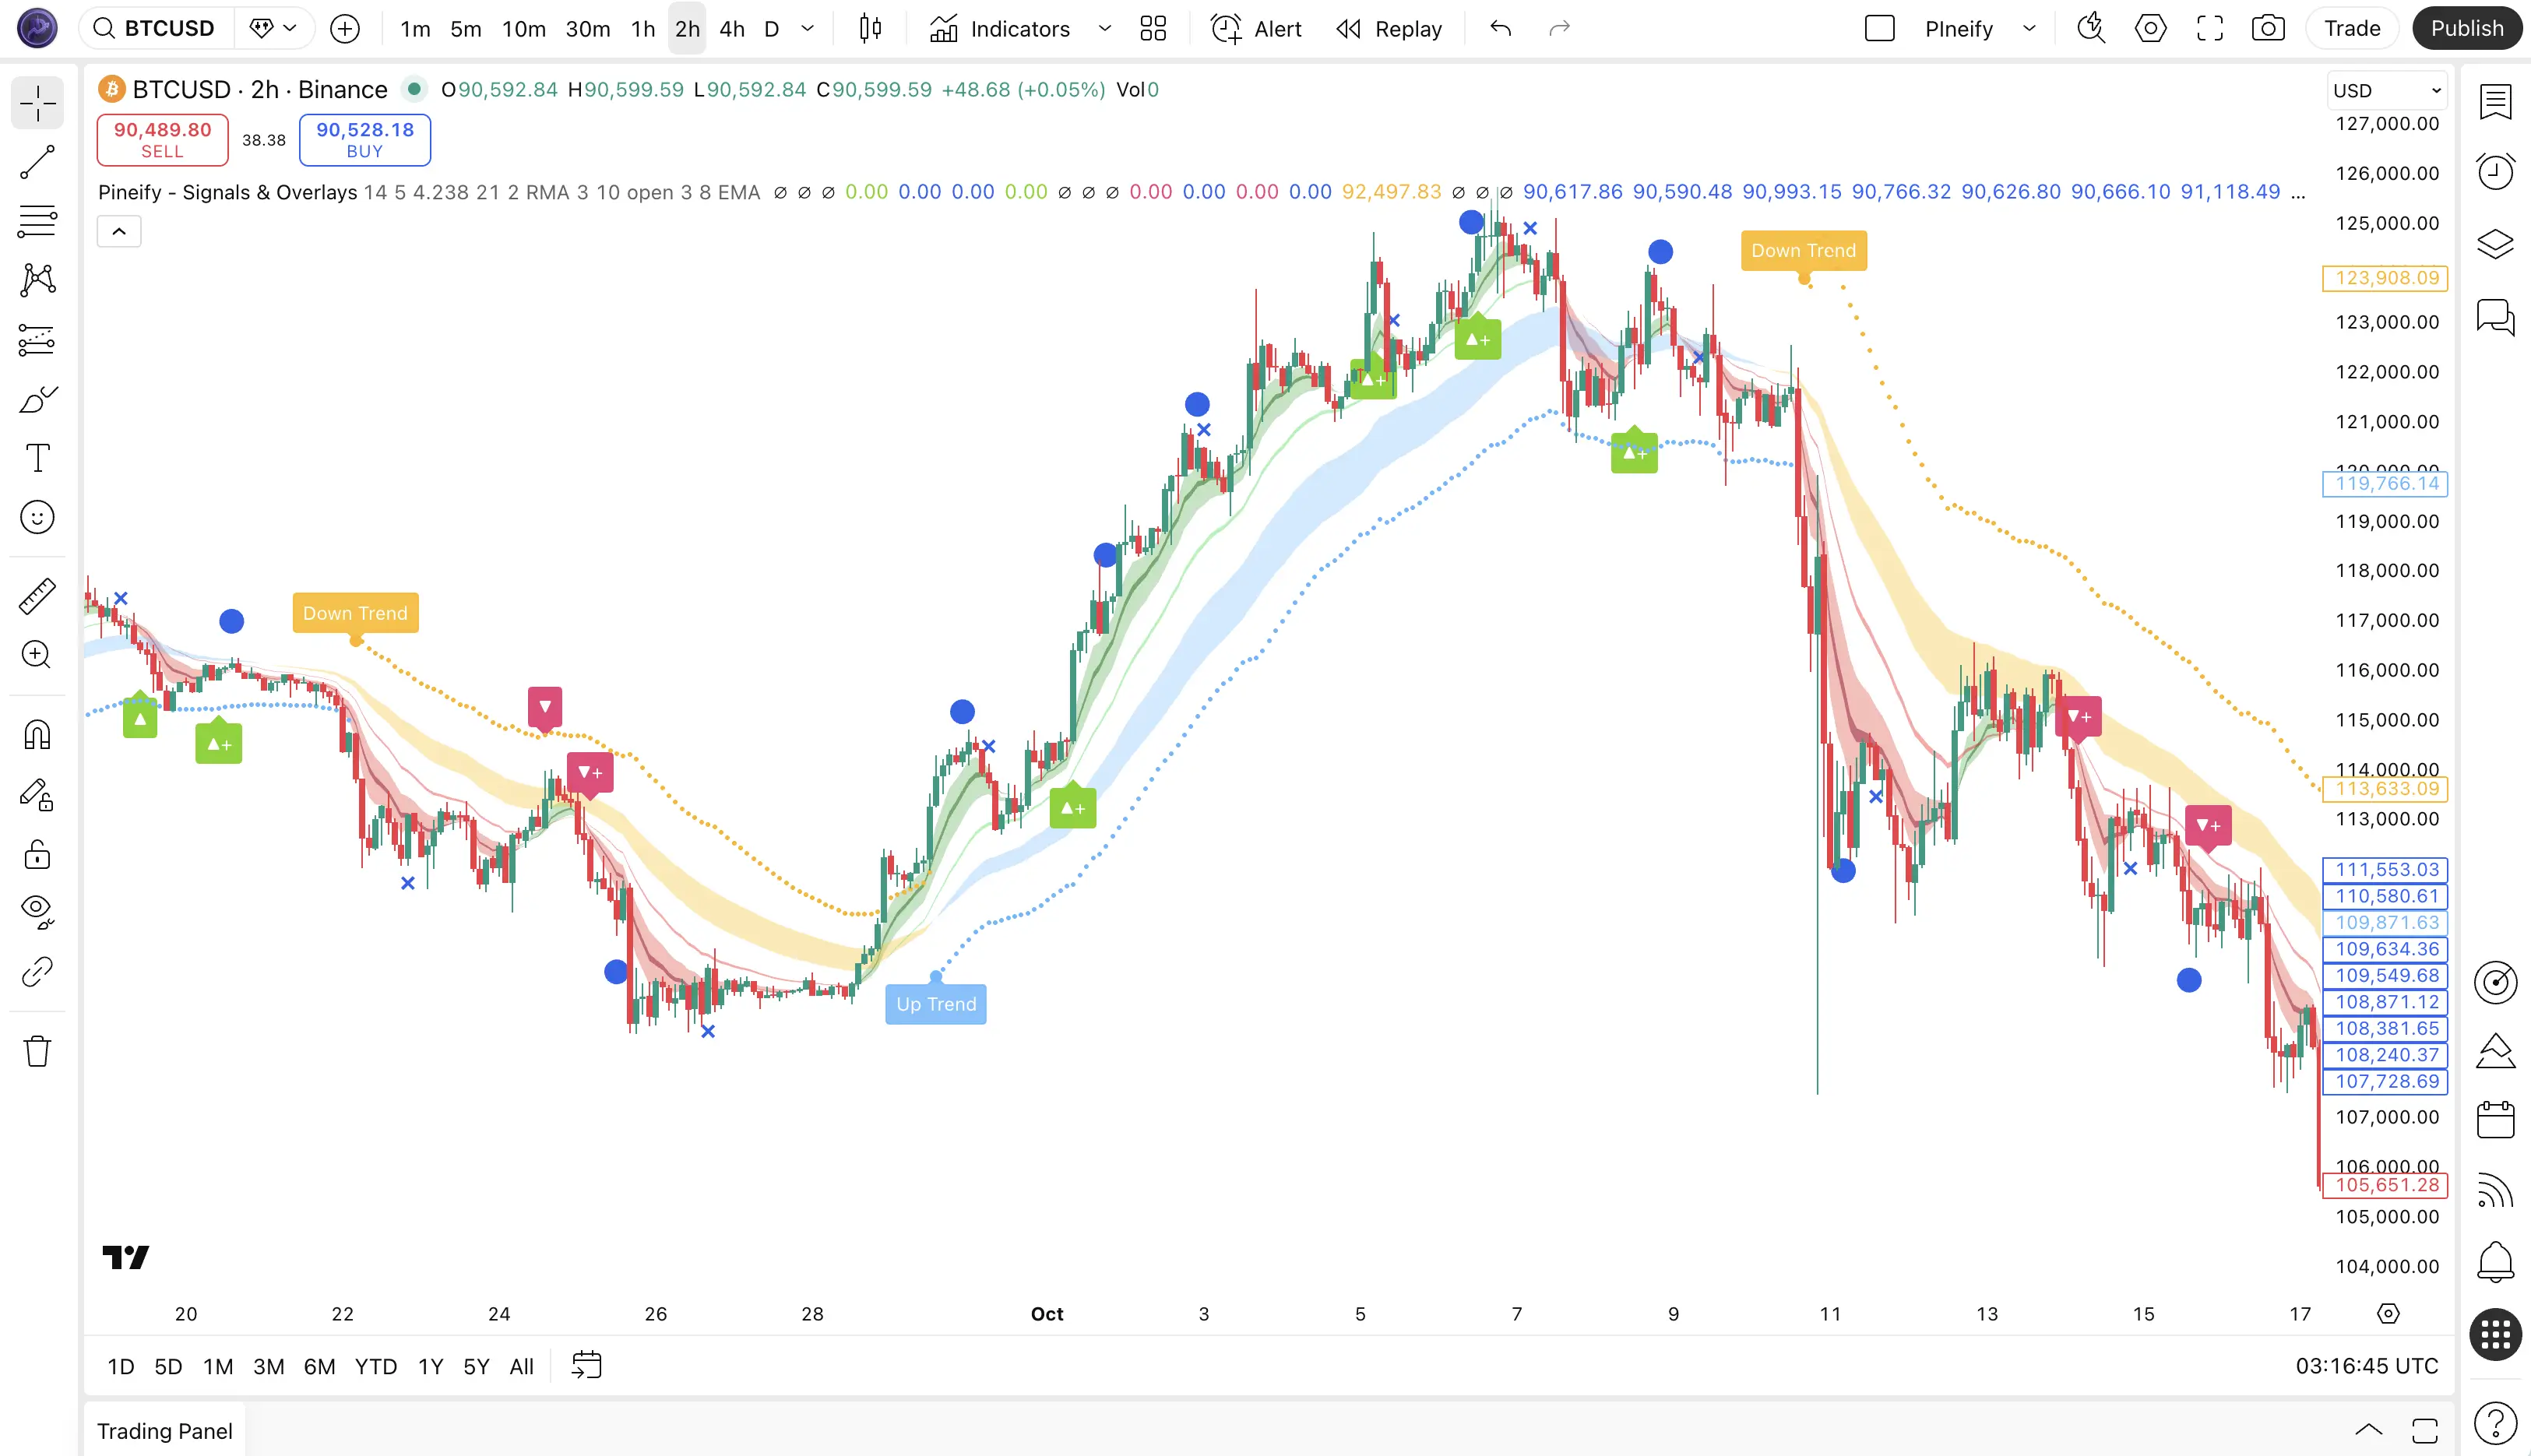
Read the big-picture cloud. Don't overthink this one. A blue or green cloud means the indicator sees a bullish environment. Red or yellow means bearish. I check this before looking at any entry signal — it keeps me from fighting the dominant trend.
-
Wait for the candle to close. When a solid ▲ LONG or ▼ SHORT arrow appears, it's your cue — but wait until that candle finishes. Mid-candle spikes are noise. I skipped this step on a TSLA trade in late February and got stopped out early. Patience matters here.
-
Set your stop at the ATR line. The indicator plots a dynamic stop level based on recent volatility. Once the trade starts moving in your favor, I move my stop to break-even. On BTCUSD's 4-hour chart, I prefer tightening the ATR multiplier to 1.5x instead of the default 2x — it gives me more room on volatile days.
This flow works whether you're trading 5-minute crypto scalps or weekly stock swings. I generally stick to 1H and 4H for my swing trades, and I haven't tested it on forex pairs, so I can't speak to how it handles NFP volatility.
Who Will Find This Indicator Useful
The indicator adapts to different trading styles without forcing you to change your approach:
- Day traders: Works on 1-minute to 15-minute charts for spotting intraday opportunities.
- Swing traders: The 4-hour and daily settings help entries align with the primary trend.
- Position traders: Weekly charts give a broader read on market phases for portfolio management.
- Beginners: A structured entry and exit framework that stops you from jumping between random indicators without a plan.
Everything traces back to classical Dow Theory, so you're not blindly following arrows. You can learn the reasoning behind each signal.
How Pineify Fits Into Your TradingView Toolkit
The TradingView marketplace is stuffed with options. Here is how Pineify compares to the common categories:
| Tool Approach | What It Offers | Key Difference |
|---|---|---|
| Standard Indicators (RSI, MACD, etc.) | Single-metric building blocks | You are the analyst — combining and interpreting is on you. |
| Multi-Feature Suites (e.g., LuxAlgo) | 20+ tools and visual overlays | Lots of options, but you still judge which signal to act on. |
| Pineify® - Signals & Overlays™ | Confluence-based signal clarity | Acts as an initial filter — only flags signals where multiple factors already agree. |
Most tools pile on more information. Pineify does the opposite. It runs in the background, waits for trend, momentum, and volatility to align, and only then highlights an opportunity for you to review.
Beyond the indicator itself, the Pineify platform lets you build custom tools — a visual editor for indicators without writing code, an AI agent to generate strategies, and a stock picker for data-backed ideas. You can see how it all connects on the pineify page.

Why Invite-Only Access Makes Sense
TradingView lets Premium users publish invite-only scripts. The creator controls who gets access. This matters for a few reasons:
- Signal quality stays intact. A tool used by thousands at once loses its edge. Fewer users means less crowding and more reliable signals.
- Support is faster. A smaller group gets quicker help and more direct input on feature updates.
- The community stays focused. People who seek out invite-only tools tend to take systematic trading seriously.
How to get access: Access is included with Pineify's Advanced or Expert subscription plans. These are one-time lifetime payments — you pay once and receive all current and future features with no recurring fees.
Understanding Pineify's Pricing Options
Pineify is running a launch special. Here are the available plans:
| Plan | Regular Price | Discounted Price | Includes Signals & Overlays? |
|---|---|---|---|
| Plus | $129 | $99 (one-time) | No |
| Advanced | $219 | $149 (one-time) | Yes |
| Expert | $369 | $259 (one-time) | Yes |
For most people the Advanced plan at $149 one-time is the sweet spot. It includes the full Signals & Overlays tool, 1,000 AI credits per month, the strategy optimizer, a trading journal, and detailed backtest reports. For more on how this compares to other suites, see why Pineify beats ChartPrime.
The Expert plan ($259) bumps AI credits to 2,500 and adds the AI Stocks & Options Picker plus the AI Finance Agent. You can find a walkthrough of the features on YouTube.
Frequently Asked Questions
▶What is Pineify Signals & Overlays?
It's a private, invite-only TradingView indicator that blends trend analysis, momentum measurement, and volatility into one confluence-driven system. Signals appear only when all three factors line up, so you get higher-probability setups with less chart clutter.
▶How do I get access to Pineify Signals & Overlays?
Access comes with a Pineify Advanced or Expert plan. Once you sign up, link your TradingView username through Pineify and the indicator shows up under Invite-only scripts in the Indicators menu.
▶How is this different from standard TradingView indicators?
Standard indicators like RSI or MACD measure one thing and leave you to figure out the conflicts yourself. Pineify evaluates trend, momentum, and volatility at the same time and only shows signals when they all agree. Less noise, fewer false starts.
▶What markets and timeframes does it work on?
It works on any symbol — stocks, crypto, forex, commodities, indices — and any timeframe from 1-minute charts to weekly. I've used it mostly on equities and crypto, not forex, so results there may differ.
▶Can it guarantee accurate signals?
No indicator can. The system backtests around 60-87% accuracy depending on conditions. The best results come from pairing these signals with solid risk management — position sizing and the ATR-based stop loss.
▶Do I need a paid TradingView subscription?
Nope. You can access the indicator using TradingView's free plan. Your Pineify plan handles access separately.
▶Can I use this alongside my other indicators?
Sure. Pineify already handles the confluence work, so you don't need to stack duplicate tools. You can still add indicators for specific purposes like volume checks or pattern recognition. Some traders pair it with the WaveTrend Oscillator for buy and sell signals to confirm momentum extremes.
Indicators like this one won't replace a trading plan or risk discipline. What they can do is remove the guesswork of interpreting conflicting signals on your chart. Whether it fits your workflow depends on whether you value confluence over volume — I've found it worth the screen space.